. 2016 Apr 15;27(8):1246-61.
doi: 10.1091/mbc.E15-08-0565. Epub 2016 Feb 24.

Mechanical confinement triggers glioma linear migration dependent on formin FHOD3

Affiliations

Mechanical confinement triggers glioma linear migration dependent on formin FHOD3

Pascale Monzo et al. Mol Biol Cell. .

Abstract

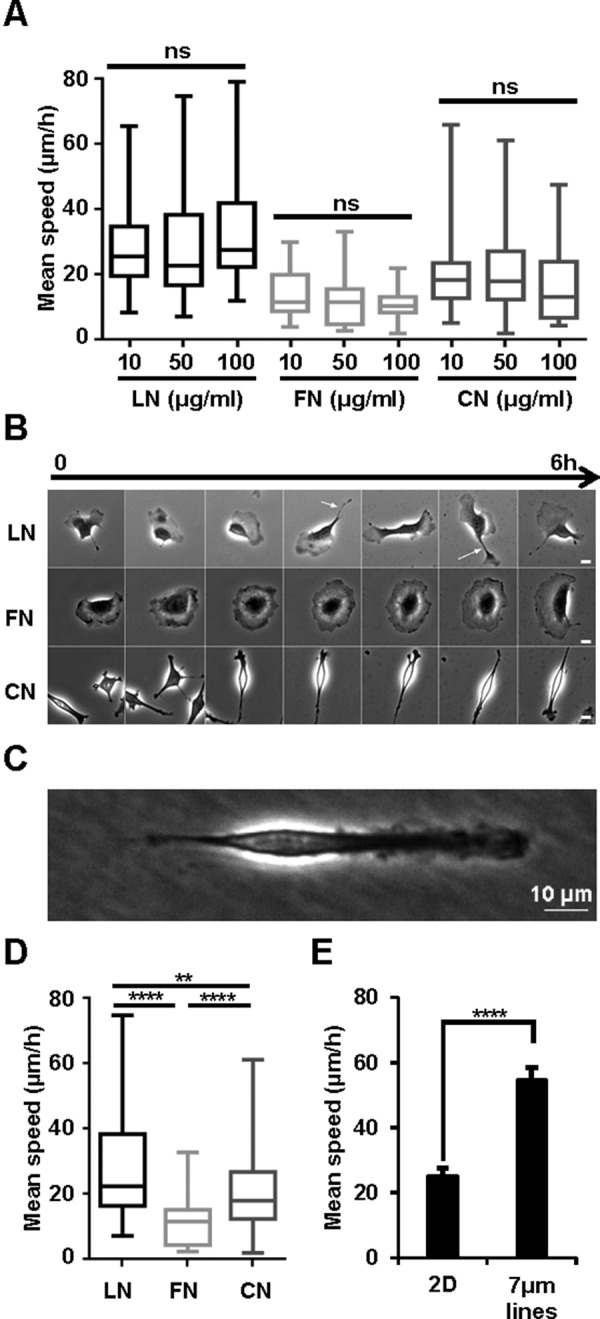
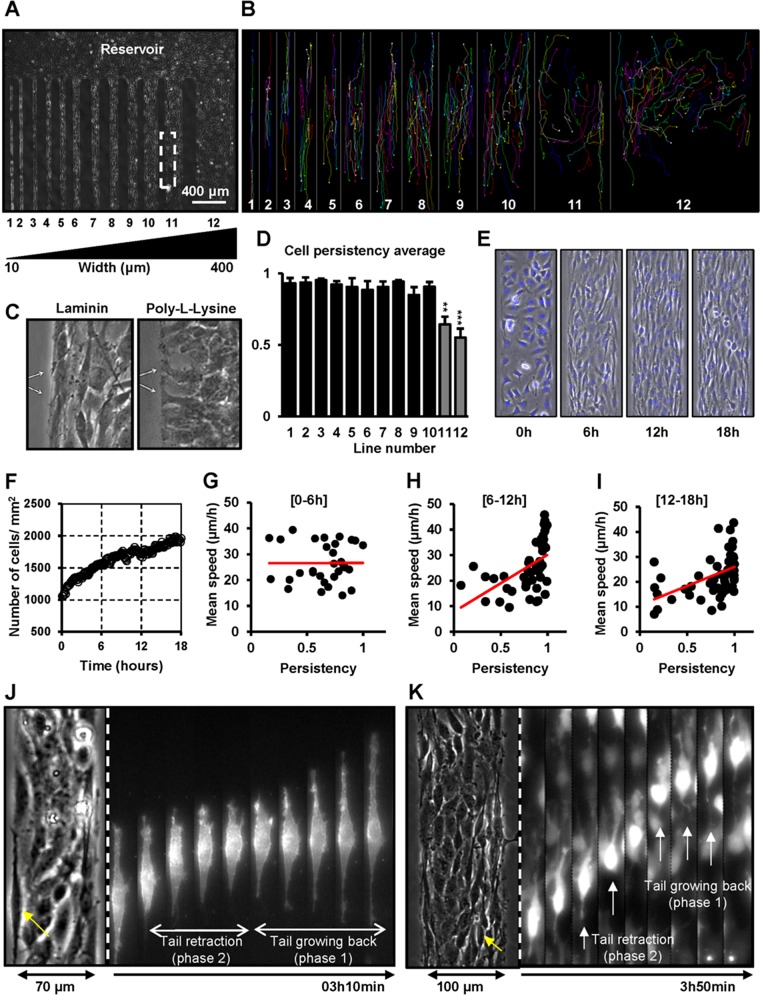
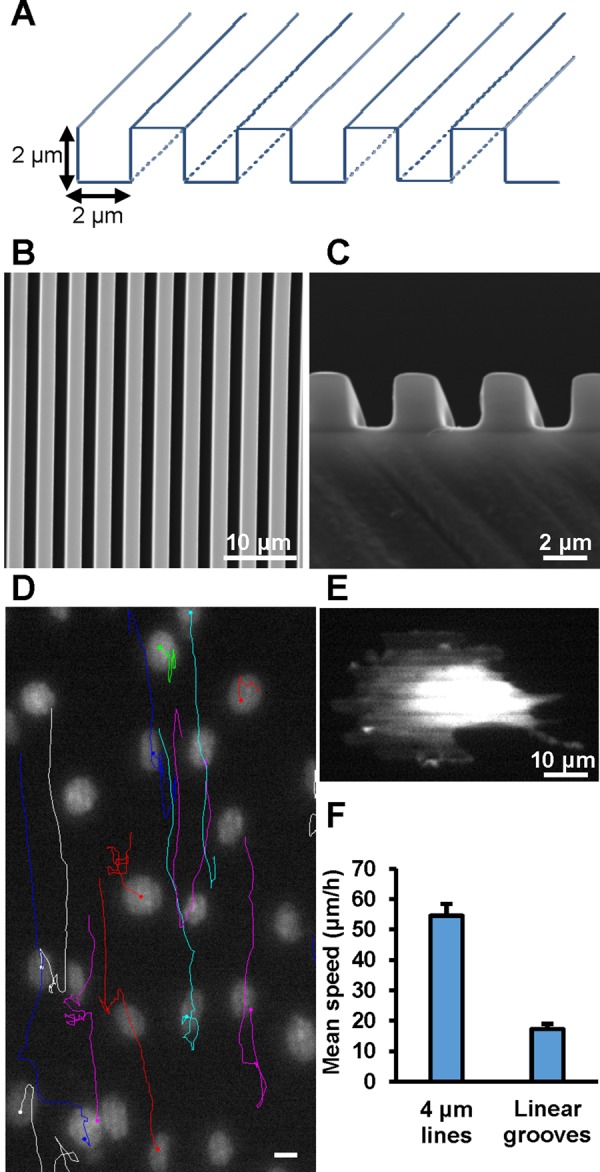
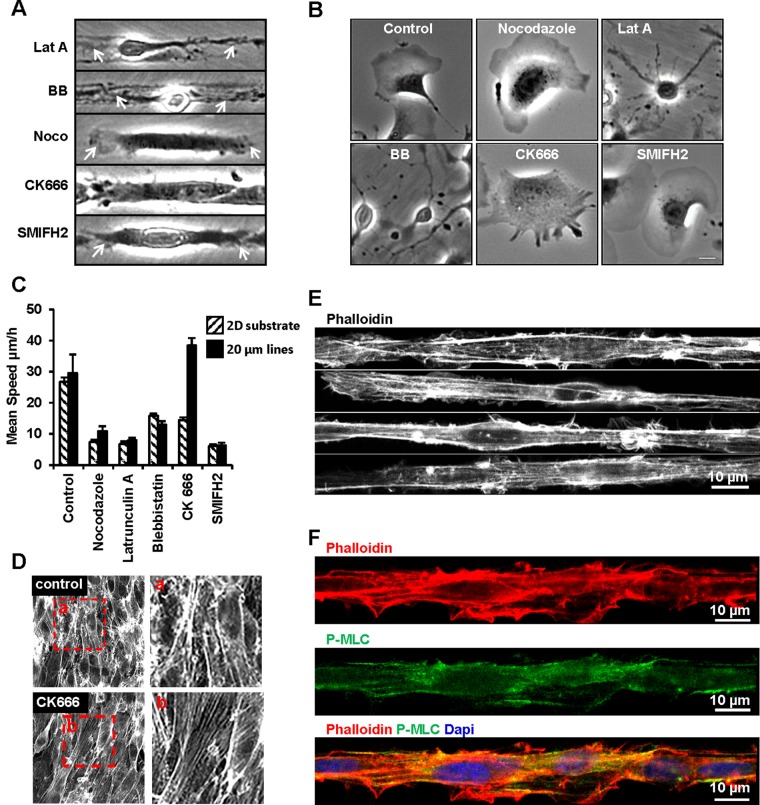
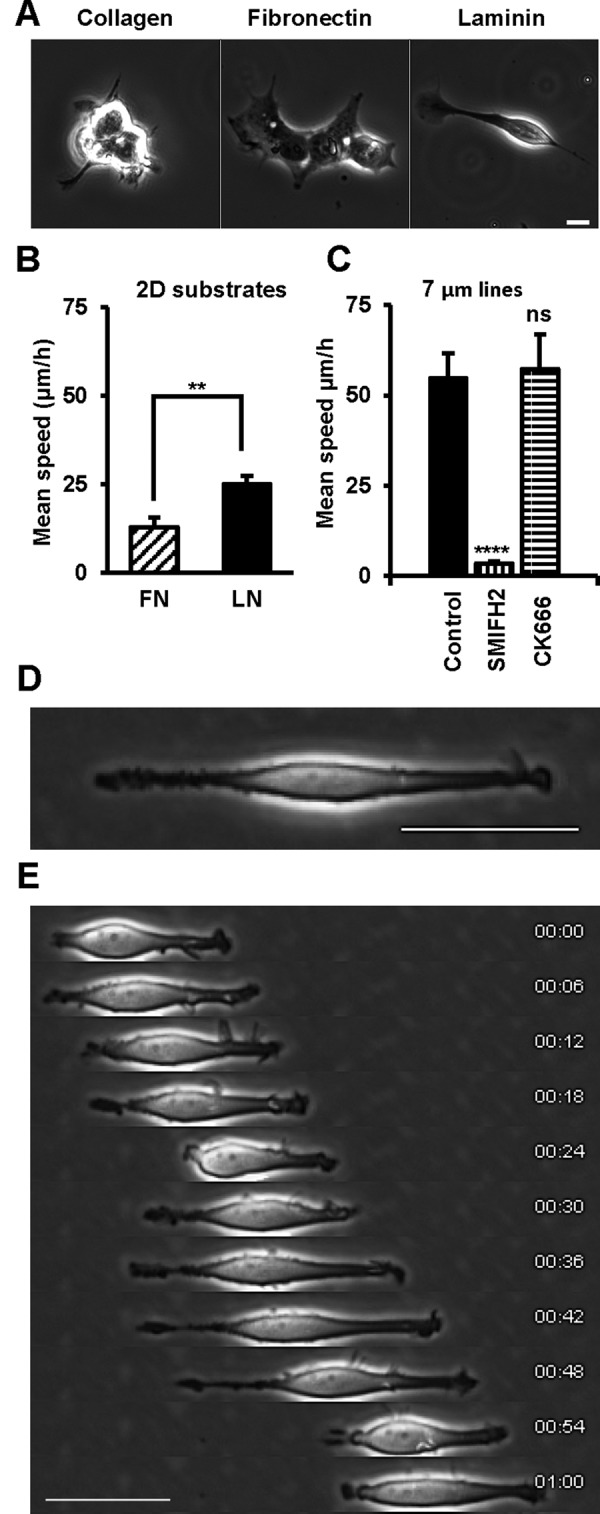
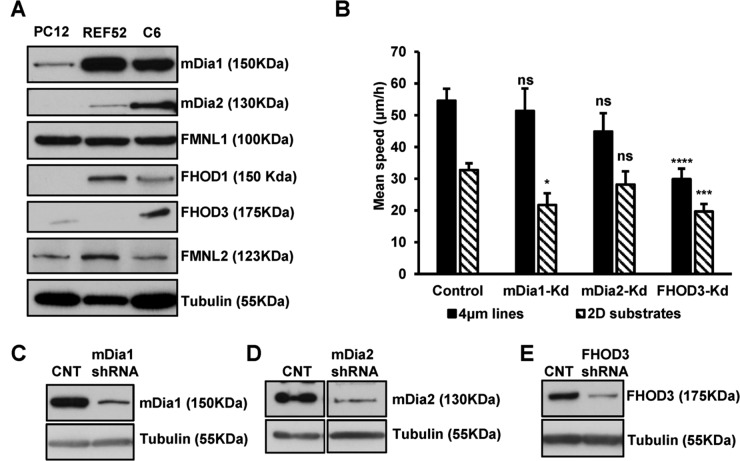
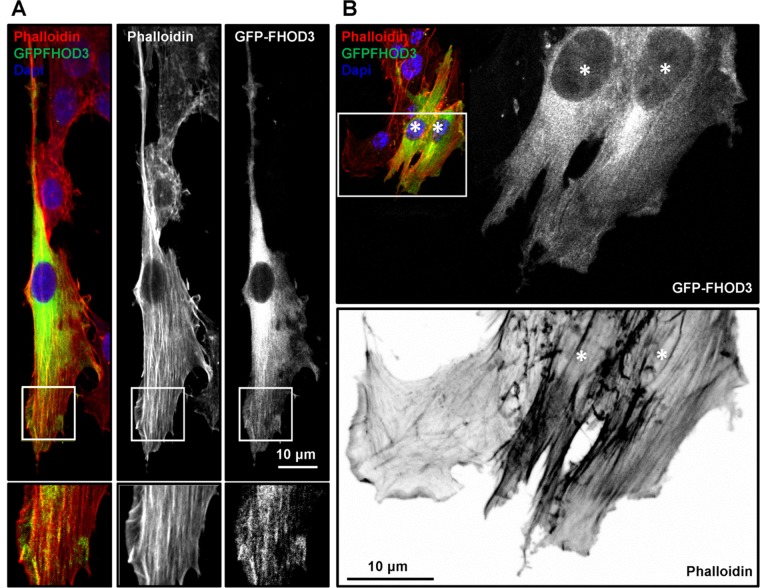
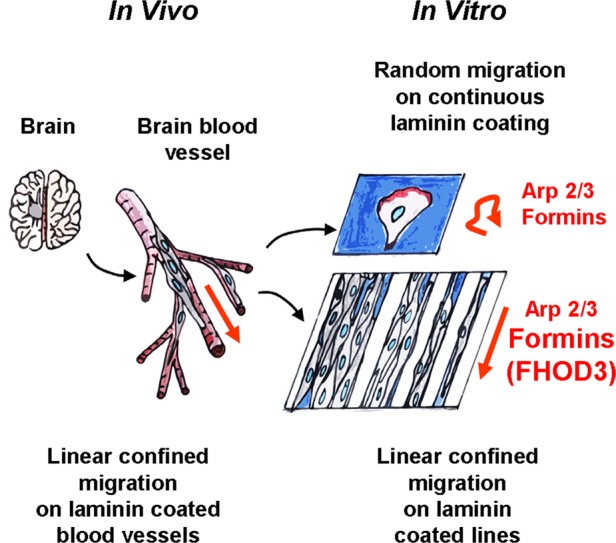
Glioblastomas are extremely aggressive brain tumors with highly invasive properties. Brain linear tracks such as blood vessel walls constitute their main invasive routes. Here we analyze rat C6 and patient-derived glioma cell motility in vitro using micropatterned linear tracks to mimic blood vessels. On laminin-coated tracks (3-10 μm), these cells used an efficient saltatory mode of migration similar to their in vivo migration. This saltatory migration was also observed on larger tracks (50-400 μm in width) at high cell densities. In these cases, the mechanical constraints imposed by neighboring cells triggered this efficient mode of migration, resulting in the formation of remarkable antiparallel streams of cells along the tracks. This motility involved microtubule-dependent polarization, contractile actin bundles and dynamic paxillin-containing adhesions in the leading process and in the tail. Glioma linear migration was dramatically reduced by inhibiting formins but, surprisingly, accelerated by inhibiting Arp2/3. Protein expression and phenotypic analysis indicated that the formin FHOD3 played a role in this motility but not mDia1 or mDia2. We propose that glioma migration under confinement on laminin relies on formins, including FHOD3, but not Arp2/3 and that the low level of adhesion allows rapid antiparallel migration.


Figures

FIGURE 1:
FIGURE 1:
Comparison of C6 glioma cell motility on different substrates. C6 glioma cells were plated on glass-bottom dishes coated with 10, 50, or 100 μg/ml laminin (LN), fibronectin (FN), or collagen (CN). Cells were imaged in phase contrast (1 image/6 min). Error bars are SDs. (A) Average of mean speed (μm/h) on each substrate. (B) Glioma cells adopt different shapes when seeded on different substrates (50 μg/ml). Montage showing snapshots of single cells during 6 h (1 frame/h). Scale bars, 10 μm. (C) Typical snapshot of a C6 glioma cell migrating on thin laminin micropatterned line. (D) Average of mean speed (μm/h) on laminin, fibronectin, and collagen at 50 μg/ml. Error bars are SD. (E) Average of mean speed (μm/h) on laminin-coated dish (2D) and 7-μm laminin micropatterned lines (7-μm lines). Error bars are SEM. p values were calculated using unpaired t tests.
FIGURE 2:
FIGURE 2:
Confined linear migration is saltatory and involves a leading process and a searching tail both containing adhesive patches and small lamellipodia. (A, B) Glioma cells were seeded on laminin-coated lines of 3-μm width and imaged every 30 s. (A) Montage corresponding to 90-min total time. (B) Kymograph corresponds to total time 3 h, 30 min; frames are 30 s apart. (C) Glioma cells were seeded on laminin-coated lines of 3-μm width and imaged every 6 min. Montage corresponds to 9-h total time. (D) Glioma cells transfected with GFP-actin and Arp3-mCherry were seeded on laminin-coated lines of 5-μm width and imaged using a TIRF microscope. Images extracted from the Supplemental Movie S4 showing the presence of Arp2/3 in lamellipodia protruding at the front, tail, and cell body. (E) Glioma cells transfected with GFP-actin and mCherry-paxillin were seeded on laminin-coated lines of 3-μm width and imaged using a TIRF microscope. Montage corresponds to 120-min total time. Paxillin-containing adhesions are present in the leading process and in the tail as noticeable patches 2 μm in length.
FIGURE 3:
FIGURE 3:
Mechanical constraint mediated by an increase in cell density triggers glioma linear migration. C6 glioma cells were plated on lines of laminin of different widths, varying from 10 µm (line1) to 400 μm (line12), and connected to a large reservoir. Cells were imaged after 1-h seeding for long periods of time in phase contrast using a 10× objective (1 image/6 min). (A) Reconstitution of the entire pattern at the end of the movie (24 h). (B) Tracks of the cell bodies during 6 h. (C) Comparison of C6 glioma cell behavior at the edge of lines coated with laminin (left) or poly-l-lysine (right). (D) Persistency average of C6 glioma cells migrating on each laminin-coated line. (E) Montage showing the transition from a 2D migration to the linear migration as the cell density increases on line 10 (130-μm width) over time. Frames are 6 h apart. Montage extracted from Supplemental Movie S8. (F) Cell density was measured on line 10 and is reported as a function of time. (G, H) Cell persistency and mean speed measured on line 10 in three different time windows. Best-fit lines are in red. R = 0.003 (G), 0.509 (H), and 0.446 (I). (J) GFP-PM–transfected cells were mixed with untransfected cells and seeded on laminin-coated lines of different sizes. GFP signal was used to follow the edges of the cells when streaming. Montage corresponds to 3 h, 10 min total time. Frames are 20 min apart. (K) C6 cells expressing GFP were seeded on 100-μm-wide laminin-coated lines and imaged in fluorescence and phase contrast using a 20× objective (1 image/10 min). Montage showing a cell using saltatory motility while migrating in the middle of the line. Frames are 30 min apart.
FIGURE 4:
FIGURE 4:
Confinement is necessary to trigger glioma linear migration. (A) Schematic of the fabricated linear grooves. Scanning electron micrograph (B) and cross-sectional scanning electron micrograph (C) of fabricated linear grooves (2 μm × 2 μm × 2 μm). (D) C6 glioma cells preincubated with Hoechst 33342 were plated on the laminin-coated fabricated linear grooves and imaged for 15 h (1 image/6 min). Image shows the overlay of the tracks and nuclei at the end of the movie. (E) Micrograph of a GFP-transfected cell migrating on top of the linear grooves. (F) Mean speed comparison of cells migrating on 4-μm lines and the fabricated linear grooves.
FIGURE 5:
FIGURE 5:
Linear migration mode involves contractile longitudinal actin cables dependent on formin but not Arp2/3. (A–C) C6 glioma cells were plated on a 2D flat surface and laminin lines of different widths. Cells were imaged for long periods of time (15–20 h) in the presence of different drugs: blebbistatin (50 μM), latrunculin (1.2 μM), nocodazole (0.1 μM), CK666 (100 μM), and SMIFH2 (20 μM). (A) Snapshots showing the effects of the drugs on the shape of the cells migrating on 10-μm lines. (B) Snapshots showing the effects of the drugs on the shape of the cells migrating on 2D surface (sparse condition). (C) Average of mean velocities (μm/h) over 6 h. Error bars represent SEM. (D) C6 glioma cells in the reservoir control or after CK666 treatment. Actin filaments were stained with Alexa 568–phalloidin and imaged using a confocal microscope. Treated cells on bottom show noticeable parallel actin bundles compared with control cells on the top. (E, F) Confocal images of glioma cells migrating on 20-μm lines fixed and stained for phospho–myosin light chain 2 (Ser-19) and phalloidin. Bars, 10 μm.
FIGURE 6:
FIGURE 6:
Linear migration mode in hGPCs. hGPCs were seeded on glass-bottom dishes coated with 50 μg/ml laminin, fibronectin, or collagen. Cells were imaged in phase contrast for 6 h (1 image/6 min). (A) Snapshots of hGPCs adopting different shapes when seeded on different substrates. Scale bar, 10 μm. (B) Average of mean speed (μm/h) over 6 h on fibronectin (FN) or laminin (LN). (C) HGPCs were seeded on 7-μm laminin-micropatterned lines. Cells were imaged in the presence of CK666 (200 μM) or SMIFH2 (10 μM). Average of mean speed (μm/h) over 6 h. Error bars are SEM. (D) Typical snapshot of hGPCs migrating on a 7-μm laminin micropatterned line. Scale bar, 50 μm. (E) Montage corresponds to 60-min total time; frames are 6 min apart. Scale bar, 50 μm.
FIGURE 7:
FIGURE 7:
Expression profile and knockdown of formins in rat C6 glioma cells suggest a role for FHOD3. (A) Expression of formins in cell extracts (30 μg) from three different rat cell lines—PC12, REF52, and C6 glioma—was examined by Western blotting with antibodies against mDia1, mDia2, FMNL1, FHOD1, FHOD3, and FMNL2. α-Tubulin was used as a loading control. (B) C6 glioma cells were transfected with shRNA targeting mDia1, mDia2, and FHOD3. Three days later, transfected cells were seeded on 4-μm laminin micropatterned lines and 2D substrates and imaged for 6–12 h. Average of mean speeds (μm/h) over 6 h. Error bars are SEM. (C–E) Expression of mDia1, mDia2, and FHOD3 in shRNA-transfected cells was examined by Western blotting with antibodies against mDia1, mDia2, and FHOD3. α-Tubulin was used as a loading control.
FIGURE 8:
FIGURE 8:
GFP-FHOD3 localizes on parallel actin filaments found in leading processes. C6 glioma cells were transfected with GFP-FHOD3 and seeded on 20-μm laminin micropatterned lines (A) and 2D substrates (B). Cells were fixed and stained with phalloidin and 4′,6-diamidino-2-phenylindole and imaged using a confocal microscope. (B) GFP-FHOD3–overexpressing cells (asterisks) among untransfected cells display excessive amounts of longitudinal actin bundles. Scale bars, 10 μm.
FIGURE 9:
FIGURE 9:
Artificial laminin tracks mimic brain blood vessel tracks and allow observations of glioma linear confined migration. Glioma cells follow linear paths coated with laminin, such as the surface of blood vessels, to invade the brain. On these paths, glioma cells use a linear confined saltatory migration. To mimic this type of motility, glioma cells are confined on artificial linear tracks, allowing long-term imaging and high-resolution microscopy. Along these tracks, glioma cells switch from 2D random motion dependent on Arp2/3 and formins (including mDia1 and FHOD3) to efficient linear migration that depends only on formins, including the formin FHOD3, which generates the actin bundles necessary for this linear motility. During this linear migration, antiparallel streams of cells are observed along the axis of the laminin tracks. Within these streams, each individual cell moves by a two-phase saltatory process similar to in vivo saltatory migration.

Similar articles

Cited by

References

    1. Agudelo-Garcia PA, De Jesus JK, Williams SP, Nowicki MO, Chiocca EA, Liyanarachchi S, Li PK, Lannutti JJ, Johnson JK, Lawler SE, et al. Glioma cell migration on three-dimensional nanofiber scaffolds is regulated by substrate topography and abolished by inhibition of STAT3 signaling. Neoplasia. 2011;13:831–840. - PMC - PubMed
    1. Ayala R, Shu T, Tsai LH. Trekking across the brain: the journey of neuronal migration. Cell. 2007;128:29–43. - PubMed
    1. Azioune A, Carpi N, Tseng Q, Thery M, Piel M. Protein micropatterns: a direct printing protocol using deep UVs. Methods Cell Biol. 2010;97:133–146. - PubMed
    1. Balzer EM, Tong Z, Paul CD, Hung WC, Stroka KM, Boggs AE, Martin SS, Konstantopoulos K. Physical confinement alters tumor cell adhesion and migration phenotypes. FASEB J. 2012;26:4045–4056. - PMC - PubMed
    1. Beadle C, Assanah MC, Monzo P, Vallee R, Rosenfeld SS, Canoll P. The role of myosin II in glioma invasion of the brain. Mol Biol Cell. 2008;19:3357–3368. - PMC - PubMed

Publication types

MeSH terms