. 2016 Feb 12;351(6274):728-733.
doi: 10.1126/science.aad0489.

mTORC1 induces purine synthesis through control of the mitochondrial tetrahydrofolate cycle

Affiliations

mTORC1 induces purine synthesis through control of the mitochondrial tetrahydrofolate cycle

Issam Ben-Sahra et al. Science. .

Abstract

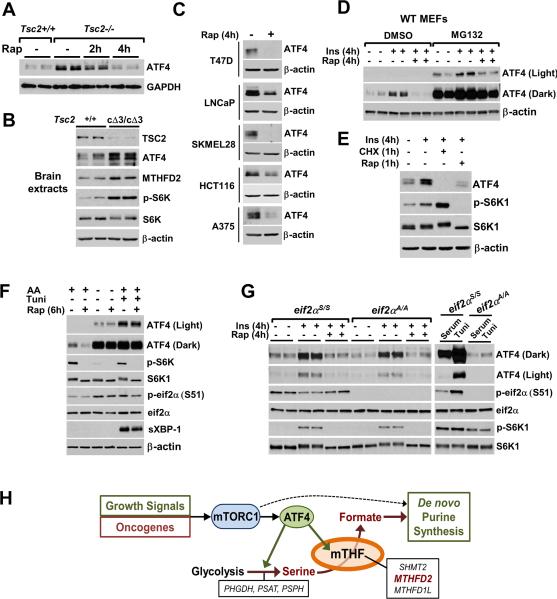
In response to growth signals, mechanistic target of rapamycin complex 1 (mTORC1) stimulates anabolic processes underlying cell growth. We found that mTORC1 increases metabolic flux through the de novo purine synthesis pathway in various mouse and human cells, thereby influencing the nucleotide pool available for nucleic acid synthesis. mTORC1 had transcriptional effects on multiple enzymes contributing to purine synthesis, with expression of the mitochondrial tetrahydrofolate (mTHF) cycle enzyme methylenetetrahydrofolate dehydrogenase 2 (MTHFD2) being closely associated with mTORC1 signaling in both normal and cancer cells. MTHFD2 expression and purine synthesis were stimulated by activating transcription factor 4 (ATF4), which was activated by mTORC1 independent of its canonical induction downstream of eukaryotic initiation factor 2α eIF2α phosphorylation. Thus, mTORC1 stimulates the mTHF cycle, which contributes one-carbon units to enhance production of purine nucleotides in response to growth signals.


Figures

Fig. 1
Fig. 1. mTORC1 stimulates de novo purine synthesis
(A) Schematic of the de novo purine synthesis pathway. (B,C) Normalized peak areas of 15N-labeled intermediates of purine (B) and pyrimidine (C) synthesis, measured by targeted LC-MS/MS, from serum-deprived Tsc2+/+ and Tsc2−/− MEFs treated with vehicle or rapamycin (20 nM) for 1 hour or 12 hours and labeled (20 min) with 15N-glutamine. (D,E) Metabolite abundance from wild-type MEFs treated as in (B,C), but stimulated with insulin (500 nM) for 1 hour or 16 hours. (F,G) Relative incorporation of radiolabel from 14C-glycine or 3H-adenine into RNA and DNA from serum-deprived Tsc2+/+ and Tsc2−/− MEFs treated with vehicle or rapamycin (8 hours, 20 nM) (F) or wild-type MEFs stimulated with insulin (6 hours, 100 nM) with or without rapamycin. (H) The given cells were labeled as in (F). (B-H) Data presented as mean ± S.D. of biological triplicates and are representative of at least two independent experiments. *P<0.05 by two-tailed Student's t test.
Fig. 2
Fig. 2. MTHFD2 is induced downstream of mTORC1 and is required for de novo purine synthesis
(A) Heat map of relative gene expression in serum-deprived MEFs treated 15 hours with vehicle or rapamycin (20 nM). Transcripts listed from highest to lowest fold increase in Tsc2−/− relative to Tsc2+/+ MEFs for each category. (B) Immunoblots from cells treated as in (A), but also with Torin 1 (250 nM) treatment. (C) MTHFD2 transcript (graphs) and protein (immunoblots) abundance in the given cell lines treated with vehicle or rapamycin (20 nM, 16 hours). (D) Schematic of serine synthesis, cytosolic and mitochondrial THF pathways, and their relation to de novo purine synthesis. (E) Normalized peak areas of 15N-labeled purine intermediates, measured by targeted LC-MS/MS, from Tsc2+/+ and Tsc2−/− MEFs 48 hours after transfection with Mthfd2 siRNAs or non-targeting controls (siCtl) and labeled (20 min) with 15N-glutamine. (F) Relative incorporation of radiolabel from 14C-serine, 14C-glycine, or 14C-formate (8 hour labeling) into RNA from Tsc2+/+ and Tsc2−/− MEFs treated as in (E). (G) Relative cell number 96 hours after transfecting Tsc2−/− MEFs as in (E), with growth in low (1%) serum with or without formate (1 mM) for final 60 hours. (C,E,F,G) Data graphed as mean ± S.D. of biological triplicates and are representative of at least two independent experiments. *P<0.05 by two-tailed Student's t test.
Fig. 3
Fig. 3. ATF4 is required for mTORC1 to induce MTHFD2 expression and purine synthesis
(A) Relative incorporation of radiolabel from 14C-glycine or 3H-adenine (8h labeling) into RNA and DNA from Tsc2+/+ and Tsc2−/− MEFs transfected with the indicated siRNAs is shown relative to that from Tsc2+/+ MEFs with control siRNAs. (B) Relative Mthfd2 transcript amounts from cells transfected as in (A). (C) Immunoblots of proteins in Tsc2−/− MEFs transfected as in (A). (D) Immunoblots from HEK293E cells expressing empty vector (Vec) or Flag-ATF4 (ATF4) treated, where indicated, with rapamycin (15h, 20nM). (C,D) Biological duplicates shown. (E) MTHFD2 transcript abundance from cells transfected as in (D). *P<0.05 by two-tailed Student's t test. (F) Cells transfected as in (D) were subjected to ChIP with control IgG, anti-Flag, or anti-Pol II antibodies. Bound promoter regions for the given genes were quantified and shown normalized to control IgG. (G) Relative incorporation of radiolabel from 14C-glycine or 14C-formate (8h labeling) into RNA from Tsc2+/+ and Tsc2−/− MEFs transfected with the indicated siRNAs is shown as in (A). (A,B,E-G) Data are mean ± S.D. of biological triplicates and are representative of at least two independent experiments.
Fig. 4
Fig. 4. mTORC1 activates ATF4 independent of cellular stress responses
(A) ATF4 abundance in MEFs deprived of serum (15 hours) and treated with rapamycin (20 nM). (B) Immunoblots of brain lysates from mice with neuron-specific deletion of Tsc2 exon 3 (cΔ3/cΔ3) compared to wild-type. (C) Amounts of ATF4 in cancer cell lines treated 4 hours with rapamycin (20 nM). (D) Amounts of ATF4 in MEFs deprived of serum (15 hours), treated with vehicle or MG132 (2 μM), with or without rapamycin (20 nM), for 30 min before insulin stimulation (4 hours). (E) Immunoblots of proteins in MEFs treated with insulin (4 hours, 500 nM) and, for the final hour, cycloheximide (10 μM) or rapamycin (20 nM). (F) Immunoblots of proteins from MEFs grown in dialyzed serum and deprived of amino acids (6 hours) or treated with tunicamycin (6 hours, 2 μg/ml) with or without rapamycin (20 nM). (G) Immunoblots of proteins from eIF2α WT (S/S) or Ser51Ala knock-in (A/A) MEFs deprived of serum (16 hours), treated with rapamycin (30 min, 20 nM), then stimulated with insulin (4 hours, 500 nM). (Right) Cells grown in serum were treated with tunicamycin (4 hours, 2 μg/ml). (A,B,D,G) Biological duplicates are shown. (H) Model of findings. See text.

Comment in

References

    1. Dibble CC, Manning BD. Signal integration by mTORC1 coordinates nutrient input with biosynthetic output. Nat Cell Biol. 2013;15:555–564. - PMC - PubMed
    1. Ben-Sahra I, Howell JJ, Asara JM, Manning BD. Stimulation of de novo pyrimidine synthesis by growth signaling through mTOR and S6K1. Science. 2013;339:1323–1328. - PMC - PubMed
    1. Robitaille AM, et al. Quantitative phosphoproteomics reveal mTORC1 activates de novo pyrimidine synthesis. Science. 2013;339:1320–1323. - PubMed
    1. Nilsson R, et al. Metabolic enzyme expression highlights a key role for MTHFD2 and the mitochondrial folate pathway in cancer. Nat Commun. 2014;5:3128. - PMC - PubMed
    1. Menon S, Manning BD. Common corruption of the mTOR signaling network in human tumors. Oncogene. 2008;27(Suppl 2):S43–51. - PMC - PubMed

Publication types

MeSH terms

Substances