. 2016 Feb 12;351(6274):733-7.
doi: 10.1126/science.aac6054.

Spatial colocalization and functional link of purinosomes with mitochondria

Affiliations

Spatial colocalization and functional link of purinosomes with mitochondria

Jarrod B French et al. Science. .

Abstract

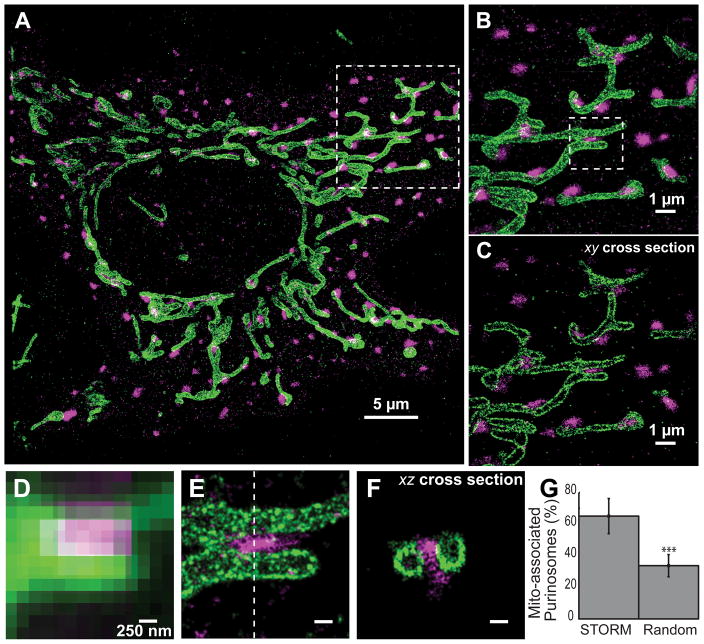
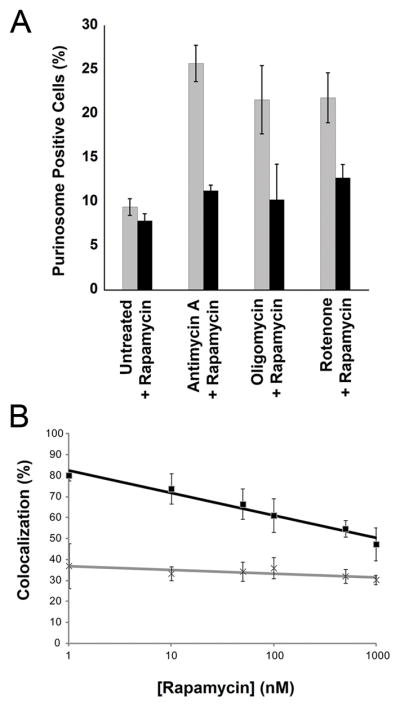
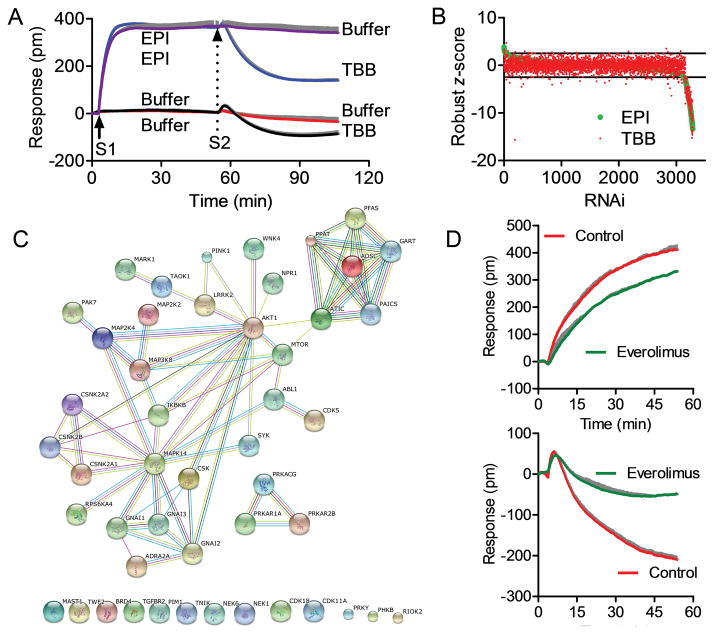
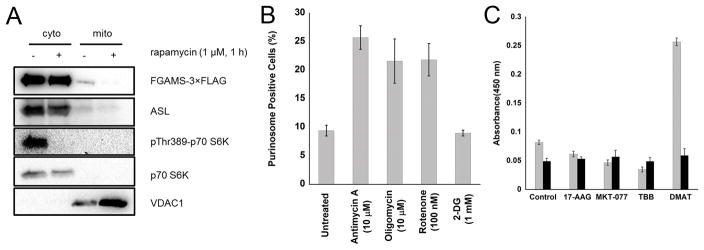
Purine biosynthetic enzymes organize into dynamic cellular bodies called purinosomes. Little is known about the spatiotemporal control of these structures. Using super-resolution microscopy, we demonstrated that purinosomes colocalized with mitochondria, and these results were supported by isolation of purinosome enzymes with mitochondria. Moreover, the number of purinosome-containing cells responded to dysregulation of mitochondrial function and metabolism. To explore the role of intracellular signaling, we performed a kinome screen using a label-free assay and found that mechanistic target of rapamycin (mTOR) influenced purinosome assembly. mTOR inhibition reduced purinosome-mitochondria colocalization and suppressed purinosome formation stimulated by mitochondria dysregulation. Collectively, our data suggest an mTOR-mediated link between purinosomes and mitochondria, and a general means by which mTOR regulates nucleotide metabolism by spatiotemporal control over protein association.


Figures

Fig. 1
Fig. 1
Super-resolution imaging of purinosomes and mitochondria. (A) 2D projection of a 3D STORM image showing purinosomes labeled with mEos2 fused to a purinosome core protein FGAMS (magenta) and mitochondria immunolabeled against outer membrane protein TOM20 (green) in a HeLa cell grown under purine-depleted conditions. (B) Zoom in of the boxed region in panel (A) showing the close proximity between the two structures. (C) An 100 nm thick xy-cross section of the region in (B). (D, E) Comparison of the conventional fluorescence image (D) and corresponding 2D projection STORM image (E) of the boxed region in (B). (F) xz-cross section along the dotted line in (E) showing a purinosome and two neighboring mitochondria. (G) The percentage of purinosomes (mean ± standard deviation colocalized with mitochondria observed using STORM (65.1 ± 11.5%) is significantly higher than the expected value for a randomized purinosome distribution (33.7 ± 7.3%). N = 26 images, student’s t-test, p≪0.001 as denoted by ***. Scale bars: 250 nm in (E–F).
Fig. 2
Fig. 2
Physical and functional links between purinosomes and mitochondria. (A) Western blot of purified mitochondria showing that purinosome proteins FGAMS and ASL co-isolate with mitochondria in a rapamycin-dependent manner. Mitochondria were isolated from HeLa cells grown under purine-depleted conditions that transiently expressed FGAMS-3×FLAG after treatment with 1 μM rapamycin (+) or vehicle control (−) for 1 h. Inhibition of mTOR was verified by observing a decrease in the phosphorylated form (pT389) of the mTOR target S6 kinase (p70-S6K). VDAC1 was used as a mitochondria loading control and p70-S6Kserved as a cytoplasmic loading control. (B) The percentage of cells with visible purinosomes (determined from at least 100 total cells) as a function of modulators of mitochondrial metabolism and glycolysis at their specified concentrations for 1 h. Values reflect mean ± standard deviation, N=3. (C) Intracellular malate (gray) and lactate (black) levels were determined by colorimetric assay after various drug treatments for 1 h (2 h for MKT-077). Values reflect mean ± standard deviation, N=3.
Fig. 3
Fig. 3
Human kinome screen identified kinases involved in α2A-adrenergic receptor (α2A-AR) activation-mediated purinosome formation. (A) Characteristic DMR of HeLa cells in response to sequential stimulation steps (S1 and S2). Red line: buffer (S1) – buffer (S2); black line: buffer – TBB; purple line: EPI – buffer; blue line: EPI – TBB. The DMR of assay buffer stimulation was used as the negative control. Buffer by itself triggered little DMR, and did not alter DMR induced by 100 nM epinephrine (EPI). EPI (100 nM) triggered a positive DMR. Conversely, TBB led to a negative DMR in the buffer pretreated cells, but a much greater negative DMR in EPI pretreated cells. (B) The robust z-score of EPI-induced DMR (green dots) or TBB-induced DMR (red dots) as a function of shRNA clones. Robust z-scores (a z-score not adversely affected by outliers) were calculated using [(experimental data − median)/median absolute deviation (MAD)] where the normalization set the median to 0 and the MAD to 1. (C) Network analysis of the α2A-AR activation mediated purinosome formation. This analysis combines all hits common to the EPI and TBB DMR responses identified using the current kinome screen with known signaling components of endogenous α2A-AR in HeLa cells, casein kinase 2 (CSNK2B, CSNK2A1, CSNK2A2) and six enzymes (PPAT, GART, PFAS, PAICS, ADSL, ATIC) involved in purine biosynthesis. Hits were selected when at least two shRNA clones for a kinase within the library gave a robust z-score of ≥ 3 or ≤ −3 (Table S2). The network was generated using STRING 9.1. Connecting lines are color coded by the type of evidence used to build the network (details in http://string-db.org/). Unconnected hits are listed at the bottom. (D) Top panel: The real-time DMR of EPI in the absence (red) or presence of everolimus (green). Bottom panel: the real-time DMR of TBB after EPI pre-stimulation in the absence (red) or presence of everolimus (green). The dose was 16 μM, 100 nM, or 20 μM for everolimus, EPI, or TBB, respectively. For (A, D), data represents mean + standard deviation, N=4. The standard deviation is shown in gray.
Fig. 4
Fig. 4
mTOR affects colocalization and functional links between purinosomes and mitochondria. (A) The percent of purinosome containing cells (determined from at least 100 cells) as a function of mitochondrial metabolism modulators in the absence (gray) and presence (black) of 100 nM rapamycin. Values reflect the mean ± standard deviation, N=3. (B) The percentage of purinosomes colocalized with mitochondria (black squares) as a function of increasing rapamycin concentration (10–1000 nM, 1 h). The results after randomization of the purinosome distribution are shown as gray crosses. The colocalization percentage is represented as the mean ± standard deviation, N=5 per condition.

Comment in

References

    1. Yamaoka T, et al. Amidophosphoribosyltransferase limits the rate of cell growth-linked de novo purine biosynthesis in the presence of constant capacity of salvage purine biosynthesis. The Journal of biological chemistry. 1997;272:17719–17725. - PubMed
    1. Yamaoka T, et al. Feedback inhibition of amidophosphoribosyltransferase regulates the rate of cell growth via purine nucleotide, DNA, and protein syntheses. The Journal of biological chemistry. 2001;276:21285–21291. - PubMed
    1. Antonioli L, Blandizzi C, Pacher P, Hasko G. Immunity, inflammation and cancer: a leading role for adenosine. Nature reviews Cancer. 2013;13:842–857. - PubMed
    1. Natsumeda Y, Prajda N, Donohue JP, Glover JL, Weber G. Enzymic capacities of purine de Novo and salvage pathways for nucleotide synthesis in normal and neoplastic tissues. Cancer research. 1984;44:2475–2479. - PubMed
    1. An S, Kumar R, Sheets ED, Benkovic SJ. Reversible compartmentalization of de novo purine biosynthetic complexes in living cells. Science. 2008;320:103–106. - PubMed

Publication types