

Conversation Maps and Diabetes Education Groups: An Evaluation at an Australian Rural Health Service
- PMID: 26912963
- PMCID: PMC4755459
- DOI: 10.2337/diaspect.29.1.32
Conversation Maps and Diabetes Education Groups: An Evaluation at an Australian Rural Health Service
Abstract
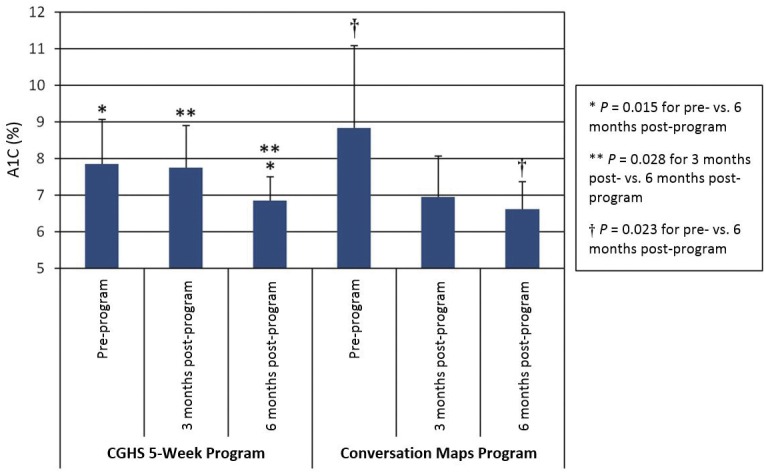
Objective. The rural Central Gippsland Health Service (CGHS) assists patients with diabetes through the provision of diabetes education. The purpose of this study was to compare and evaluate the CGHS 5-week didactic program and a modified group-participatory Conversation Maps diabetes education program. Method. A pre- and post-program survey was conducted of clients who attended the two different diabetes education programs. The survey consisted of a self-constructed demographic questionnaire, the Diabetes Knowledge Test, the Diabetes Empowerment Scale, and the Diabetes Self-Care Activities Measure. Results. For the CGHS program, there were no differences between pre- and post-program surveys in knowledge scores (11.05 ± 3.56 vs. 12.75 ± 4.19, P = 0.0883, n = 20), self-care activities (4.46 ± 1.11 vs. 4.83 ± 0.68, P = 0.0832, n = 12), or empowerment scores (7.16 ± 1.60 vs. 7.92 ± 1.26, P = 0.0540, n = 17). For the modified Conversation Maps program, there were significant improvements between pre- and post-program surveys in knowledge scores (12.42 ± 4.15 vs. 15.54 ± 3.79, P = 0.0004, n = 26), self-care activities (4.74 ± 1.09 vs. 5.32 ± 0.80, P = 0.0139, n = 24), and empowerment scores (6.56 ± 2.19 vs. 8.11 ± 1.46, P = 0.0016, n = 21). The greatest difference between the two programs was observed in knowledge gain (P = 0.0178). Overall, participants were satisfied with both programs, with no difference seen in satisfaction levels (P = 0.9763). A1C results improved in both programs to a mean of 6.7% (P = 0.0071 for CGHS and P = 0.0092 for Conversation Maps). Conclusion. The modified Conversation Maps program resulted in significant improvements for rural participants.
Figures

Similar articles
-
Education in foot care using dialogic learning or conversation maps for people with diabetes.Patient Educ Couns. 2025 Aug;137:108823. doi: 10.1016/j.pec.2025.108823. Epub 2025 May 15. Patient Educ Couns. 2025. PMID: 40378777
-
Impact of "Conversation Maps" on diabetes distress and self-efficacy of Chinese adult patients with type 2 diabetes: a pilot study.Patient Prefer Adherence. 2016 May 24;10:901-8. doi: 10.2147/PPA.S95449. eCollection 2016. Patient Prefer Adherence. 2016. PMID: 27307710 Free PMC article.
-
The effectiveness of internet-based e-learning on clinician behavior and patient outcomes: a systematic review protocol.JBI Database System Rev Implement Rep. 2015 Jan;13(1):52-64. doi: 10.11124/jbisrir-2015-1919. JBI Database System Rev Implement Rep. 2015. PMID: 26447007
-
From rural beginnings to statewide roll-out: Evaluation of facilitator training for a group-based diabetes prevention program.Aust J Rural Health. 2010 Apr;18(2):59-65. doi: 10.1111/j.1440-1584.2010.01126.x. Aust J Rural Health. 2010. PMID: 20398045
-
Bringing in a conversation in health and education: A missing link?In: Mji G, editor. The walk without limbs: Searching for indigenous health knowledge in a rural context in South Africa [Internet]. Cape Town (ZA): AOSIS; 2019. Chapter 10. In: Mji G, editor. The walk without limbs: Searching for indigenous health knowledge in a rural context in South Africa [Internet]. Cape Town (ZA): AOSIS; 2019. Chapter 10. PMID: 32726100 Free Books & Documents. Review. No abstract available.
References
-
- International Diabetes Federation IDF Diabetes Atlas, 2012. Available from http://www.idf.org/diabetesatlas/5e/the-global-burden. Accessed 25 August 2013.
-
- Magliano DJ, Peeters A, Vos T, et al. . Projecting the burden of diabetes in Australia: what is the size of the matter? Aust N Z J Public Health 2009;33:540–543 - PubMed
-
- Diabetes Australia Australian Diabetes Map. Geospatial Map Australia, 2011. Available from http://www.ndss.com.au. Accessed 17 January 2014
-
- Overland J, Yue DK, Mira M. Use of Medicare services related to diabetes care: the impact of rural isolation. Aust J Rural Health 2001;9:311–316 - PubMed
-
- Phillips A. Health Status differentials across rural and remote Australia. Aust J Rural Health 2009;17:2–9 - PubMed
LinkOut - more resources
Full Text Sources
Other Literature Sources
