Review
. 2014 Dec 24;25(1):4747.
doi: 10.4081/ejtm.2015.4747. eCollection 2015 Jan 7.

Revealing T-Tubules in Striated Muscle with New Optical Super-Resolution Microscopy Techniquess

Affiliations
Review

Revealing T-Tubules in Striated Muscle with New Optical Super-Resolution Microscopy Techniquess

Isuru D Jayasinghe et al. Eur J Transl Myol. .

Abstract

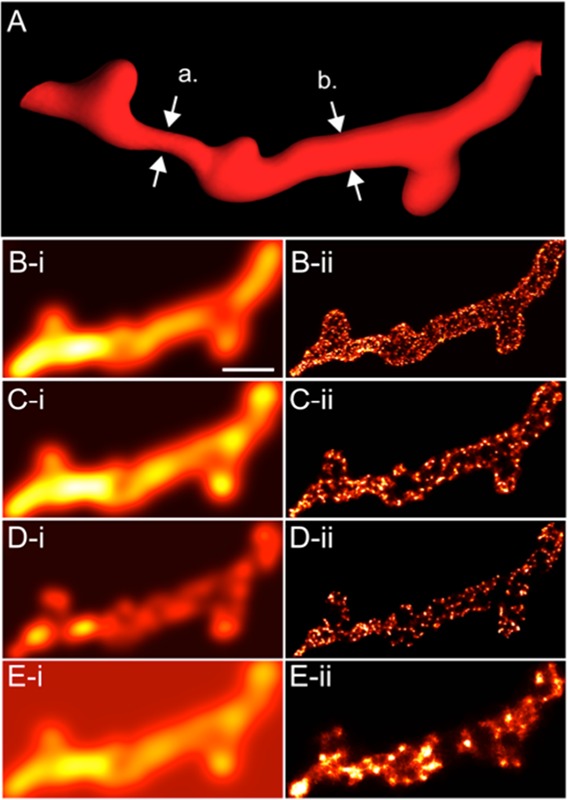
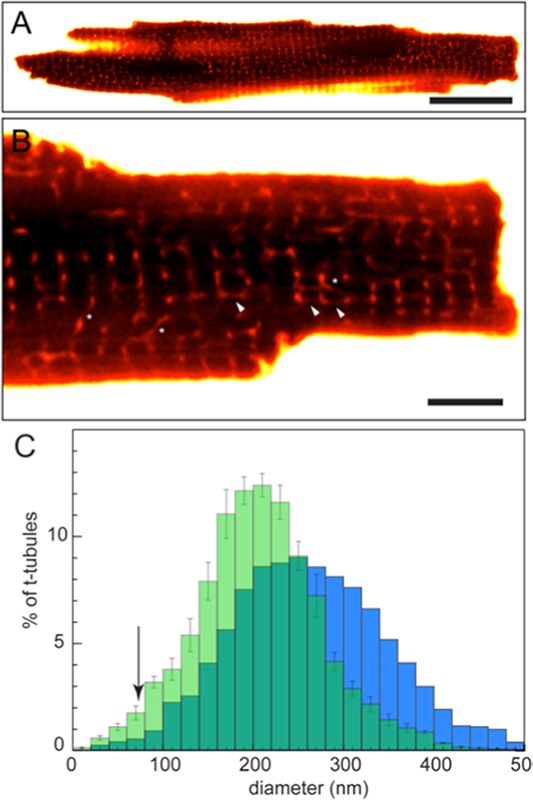
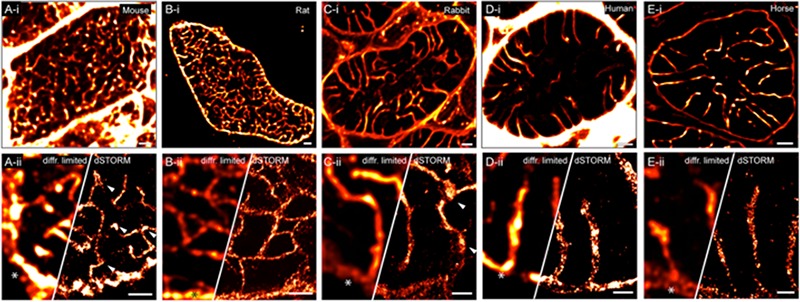
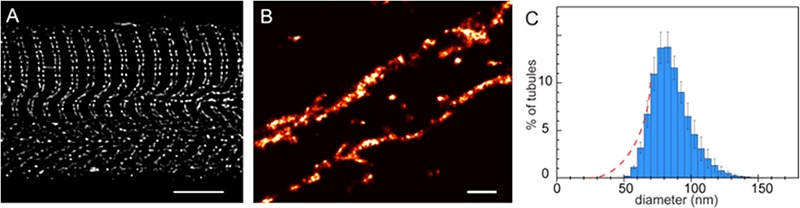
The t-tubular system plays a central role in the synchronisation of calcium signalling and excitation-contraction coupling in most striated muscle cells. Light microscopy has been used for imaging t-tubules for well over 100 years and together with electron microscopy (EM), has revealed the three-dimensional complexities of the t-system topology within cardiomyocytes and skeletal muscle fibres from a range of species. The emerging super-resolution single molecule localisation microscopy (SMLM) techniques are offering a near 10-fold improvement over the resolution of conventional fluorescence light microscopy methods, with the ability to spectrally resolve nanometre scale distributions of multiple molecular targets. In conjunction with the next generation of electron microscopy, SMLM has allowed the visualisation and quantification of intricate t-tubule morphologies within large areas of muscle cells at an unprecedented level of detail. In this paper, we review recent advancements in the t-tubule structural biology with the utility of various microscopy techniques. We outline the technical considerations in adapting SMLM to study t-tubules and its potential to further our understanding of the molecular processes that underlie the sub-micron scale structural alterations observed in a range of muscle pathologies.

Keywords: cardiac muscle; excitation-contraction coupling; horse; human; mouse; rabbit; rat; skeletal muscle; super-resolution microscopy; t-tubules.


Figures

Fig 1.
Fig 1.
Simulating the effect of labelling densities and background fluorescence on diffraction-limited and SMLM images. (A) A phantom t-tubule with a varying diameter (a = 130 nm and b = 280 nm) and a 20 nm-thick layer of fluorescent markers (similar to combined thickness of a layer of primary and secondary antibodies bound to a t-tubular protein; e.g. caveolin-3) is simulated in (i) confocal micrographs and (ii) typical 2D dSTORM. Images were simulated for labelling densities of (B) 0.12/nm2, typical of very high fluorophore densities, (C) 0.008/nm2, typically achieved in experimental samples and (D) 0.0005/nm2 to simulate a 15-fold poorer labelling than typical. Notice the gradual loss of detail in the dSTORM images with the diminishing labelling density and little observable difference between the confocal images (B-i & C-i). To simulate the effect of higher background intensity (E), the background intensity was set to 50% of the foregraound intensity and a foreground labelling density comparable to the simulation in panel-C. Notice the lack of detail on the dSTORM image (E-ii compared to C-ii) while little change is seen in the morphologies in the confocal images (E-i compared to C-i). Scale bar: 500 nm.
Fig 2.
Fig 2.
Confocal fluorescence microscopy of t-tubules of isolated living myocytes. (A) A whole cell longitudinal confocal image of a rat ventricular myocyte immersed in a dextran-linked fluorescein solution similar to the method used by Soeller and Cannell. (B) Magnified view illustrates the membrane impermeable dextran-fluorescein entry into the t-tubules reporting local tubule geometry and volume against the dark background of the myoplasm. Note the oblique (asterisk) and longitudinal tubules (arrowheads) that are clearly visible with this approach. (C) The percentage distribution of local tubule diameter estimates from such diffraction-limited data (blue bars; Soeller & Cannell) has a similar mean to that based on dSTORM data. Note the limited measurements (poor detection) of tubule diameters that are <70 nm in the diffraction-limited analysis (arrow), while the dSTORM analysis is able to detect >2-times the fraction of tubules narrower than 70 nm. Scale bars: A: 20 µm, B: 5 µm.
Fig 3.
Fig 3.
Comparison of micron- and nanometre-scale morphologies in adult mammalian cardiac t-systems. Transverse (i) Confocal and (ii) dSTORM images blurred with a 2D Gaussian PSF equivalent to a confocal PSF (left panels) and super-resolution image (right). Shown myocytes of (A) C57-BL/6 mouse and (B) Wistar rat were stained with a combination of NCX1 and CAV3. Fixed ventricular tissue sections from (C) New Zealand White rabbit, (D) Human (54-year old donor with normal echocardiogram) and (E) Horse (12-year old female New Forest pony) were stained with fluorescent wheat germ agglutinin to visualise the t-tubules. Note the nanometre- and micron-scale t-tubule dilatations in mouse and rabbit myocytes respectively (arrowheads). Cell surface in each example is indicated by asterisks. Scale bars: i-panels: 2 µm; ii: 1 µm.
Fig 4.
Fig 4.
Visualisation of t-tubules in mammalian skeletal muscle. (A) A longitudinal confocal micrograph of a “mechanically skinned” rat extensor digitorum longus (EDL) fibre with membrane impermeable dye trapped in the t-system. (B) A dSTORM image of t-tubule organisation in the flanks of a single z-line of a similar fibre. T-tubules were filled with fixable dextran and the fibre was skinned to trap the dye prior to fixation. (C) Shown is a percentage histogram of the mean diameter of t-tubules in adult rat EDL fibres calculated by modelling the tubules as flattened cylinders. Notice the left-skewed shape of the histogram, which is a result of the poor detection efficiency of tubules with a mean diameter narrower than ~40 nm. More tubules are expected to be detected with smaller diameters (expected fractions approximated by dashed lines) with the super-resolution method. Scale bars: A: 5 µm; B: 0.5 µm.

References

    1. Franzini-Armstrong C, Protasi F. Ryanodine receptors of striated muscles: a complex channel capable of multiple interactions. Physiol Rev 1997;77:699-729. Epub 1997/07/01. - PubMed
    1. Asghari P, Scriven DR, Sanatani S, et al. Nonuniform and variable arrangements of ryanodine receptors within mammalian ventricular couplons. Circ Res 2014;115:252-62. Epub 2014/05/03. - PubMed
    1. Jayasinghe ID, Munro M, Baddeley D, Launikonis BS, Soeller C. Observation of the molecular organization of calcium release sites in fast- and slow-twitch skeletal muscle with nanoscale imaging. J R Soc Interface 2014;11(99). Epub 2014/08/08s. - PMC - PubMed
    1. Huxley AF. Local activation of striated muscle from the frog and the crab. J Physiol 1957;135:17-8P. Epub 1957/01/23. - PubMed
    1. Escobar M, Cardenas C, Colavita K, Petrenko NB, Franzini-Armstrong C. Structural evidence for perinuclear calcium microdomains in cardiac myocytes. J Mol Cell Cardiol 2011;50:451-9. Epub 2010/12/15. - PubMed