. 2016 Feb 25;7(2):e2109.
doi: 10.1038/cddis.2015.356.

Increased expression of long noncoding RNA TUG1 predicts a poor prognosis of gastric cancer and regulates cell proliferation by epigenetically silencing of p57

Affiliations

Increased expression of long noncoding RNA TUG1 predicts a poor prognosis of gastric cancer and regulates cell proliferation by epigenetically silencing of p57

E Zhang et al. Cell Death Dis. .

Abstract

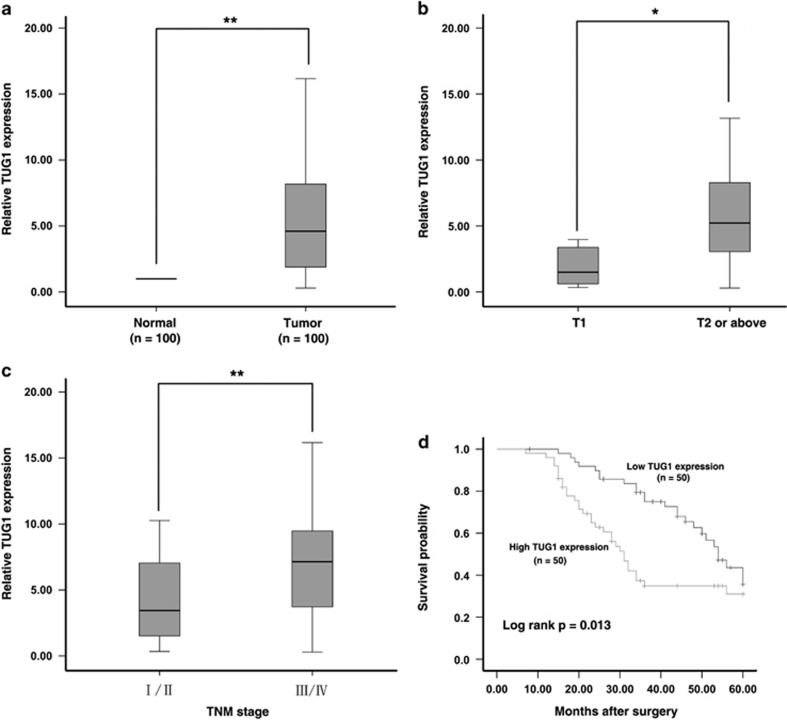
Recent evidence highlights long noncoding RNAs (lncRNAs) as crucial regulators of cancer biology that contribute to tumorigenesis. LncRNA TUG1 was initially detected in a genomic screen for genes upregulated in response to taurine treatment in developing mouse retinal cells. Our previous study showed that TUG1 could affect cell proliferation through epigenetically regulating HOXB7 in human non-small cell lung cancer. However, the clinical significance and potential role of TUG1 in GC remains unclear. In this study, we found that TUG1 is significantly increased and is correlated with outcomes in gastric cancer (GC). Further experiments revealed that knockdown of TUG1 repressed GC proliferation both in vitro and in vivo. Mechanistic investigations showed that TUG1 has a key role in G0/G1 arrest. We further demonstrated that TUG1 was associated with PRC2 and that this association was required for epigenetic repression of cyclin-dependent protein kinase inhibitors, including p15, p16, p21, p27 and p57, thus contributing to the regulation of GC cell cycle and proliferation. Together, our results suggest that TUG1, as a regulator of proliferation, may serve as a candidate prognostic biomarker and target for new therapies in human GC.


Figures

Figure 1
Figure 1
Expression of TUG1 in GC tissues and its clinical parameters. (a) Relative expression of TUG1 in GC tissues (N=100) compared with the corresponding non-tumor tissues (N=100). TUG1 expression was examined using quantitative real-time PCR (qRT-PCR) and normalized to β-actin expression. The results are presented as the fold-change in tumor tissues relative to normal tissues. (b and c) Higher TUG1 was positively correlated with advanced invasion depth and TNM stage. (d) Patients with high levels of TUG1 expression showed reduced survival times compared with patients with low levels of TUG1 expression. *P<0.05, **P<0.01
Figure 2
Figure 2
TUG1 regulates GC cell proliferation in vitro. (a) Analysis of TUG1 expression levels in GC cell lines (AGS, BGC-823, MGC-803 and SGC-7901) compared with a normal gastric epithelium cell line (GES-1) by qRT-PCR. (b) The relative expression level of TUG1 in GC cells, transfected with si-NC or si-TUG1 (si-TUG1#1 and #2), was tested using qPCR. (c) MTT assays were performed to determine cell proliferation of AGS and BGC-823 cells after transfection of siRNA against TUG1. (d) The representative results of colony formation of AGS and BGC-823 cells transfected with siRNA against TUG1. (e) At 48 h after transfection, the cell cycle was analyzed by flow cytometry. The bar chart represents the percentage of cells in G1–G0, S, or G2–M phase, as indicated. *P<0.05, **P<0.01
Figure 3
Figure 3
The impact of TUG1 on tumorigenesis in vivo. (a and b) Scramble or shTUG1 was transfected into AGS cells, which were injected into nude mice (n=7). The tumor volumes were calculated every 2 days after injection. The bars indicate S.D. (c) The tumor weights are shown as means of tumor weights±S.D. qRT-PCR was performed to detect the average expression of TUG1. (d) Histopathology of xenograft tumors. The tumor sections underwent H&E staining and IHC staining using antibodies against Ki-67 and p57. Bar, 100μm. Error bars indicate means±S.E.M. *P<0.05, **P<0.01
Figure 4
Figure 4
TUG1 is associated with PRC2 in GC. (a) The expression of p15, p16, p21, p27 and p57 was determined after knockdown of TUG1 using qRT-PCR. (b) TUG1 nuclear localization, as identified using qRT-PCR in fractionated BGC-823 and AGS cells. After nuclear and cytosolic separation, RNA expression levels were measured by qRT-PCR. GAPDH was used as a cytosolic marker, and U6 was used as a nuclear marker. (c) RIP experiments were performed, and the coprecipitated RNA was subjected to qRT-PCR for TUG1. The fold enrichment of TUG1 in RIPs is relative to its matching IgG control RIP. *P<0.05, **P<0.01
Figure 5
Figure 5
TUG1 is required to target PRC2 occupancy and activity to epigenetically regulate the expression of CKIs, thus regulating GC cell cycle and proliferation. (a) The expression of p15, p16, p21, p27 and p57 in BGC-823 and AGS cells, after knockdown of EZH2 and SUZ12. (b) ChIP-qPCR of H3K27me3 and EZH2 of the promoter region of the p15, p16, p21, p27 and p57 locus after siRNA treatment targeting si-NC or si-TUG1 in AGS cells. Antibody enrichment was quantified relative to the amount of input DNA. Antibody directed against IgG was used as a negative control. (c) The expression of EZH2 and SUZ12 in BGC-823 and AGS cells, after knockdown of TUG1. *P<0.05, **P<0.01
Figure 6
Figure 6
The role of p57 in GC. (a) Immunohistochemistry was used to detect the expression of EZH2 protein in 30 pairs of GC with corresponding non-tumor tissues. Bar, 100μm. The immunoreactivity of EZH2 protein in GC tissues showed a statistically significant positive correlation with the relative level of TUG1 expression. (b) AGS and BGC-823 cells transfected with si-NC/si-EZH2. Forty-eight hours after transfection, the cells were analyzed using flow cytometry. (c) As determined by qRT-PCR assays, the level of p57 was downregulated in 30 pairs of GC tissues. Western blot assays detected the expression of p57 after transfection. AGS cells were transfected with Vector/p57. Forty-eight hours after transfection, the cells were analyzed using MTT assays and flow cytometry. AGS cells were transfected with si-NC/si-TUG1/si-TUG1+vector and transfected with si-TUG1 followed by transfection with pcDNA-p57. After transfection, the cells were stained and analyzed using flow cytometry. MTT analysis of cell proliferation by co-transfection (si-NC, si-TUG1 1#, si-TUG1 1#+si-NC, si-TUG1 1#+si-p57, si-TUG1 1#+si-p21). *P<0.05, **P<0.01

Similar articles

Cited by

References

    1. Coupland VH, Lagergren J, Luchtenborg M, Jack RH, Allum W, Holmberg L et al. Hospital volume, proportion resected and mortality from oesophageal and gastric cancer: a population-based study in England, 2004-2008. Gut 2013; 62: 961–966. - PubMed
    1. Camargo MC, Kim WH, Chiaravalli AM, Kim KM, Corvalan AH, Matsuo K et al. Improved survival of gastric cancer with tumour Epstein-Barr virus positivity: an international pooled analysis. Gut 2014; 63: 236–243. - PMC - PubMed
    1. Amaral PP, Dinger ME, Mercer TR, Mattick JS. The eukaryotic genome as an RNA machine. Science 2008; 319: 1787–1789. - PubMed
    1. Guttman M, Amit I, Garber M, French C, Lin MF, Feldser D et al. Chromatin signature reveals over a thousand highly conserved large non-coding RNAs in mammals. Nature 2009; 458: 223–227. - PMC - PubMed
    1. Nagano T, Fraser P. No-nonsense functions for long noncoding RNAs. Cell 2011; 145: 178–181. - PubMed

Publication types

MeSH terms

Substances