. 2016 Mar;13(3):222-228.
doi: 10.1038/nmeth.3766.

Genome-wide footprinting: ready for prime time?

Affiliations

Genome-wide footprinting: ready for prime time?

Myong-Hee Sung et al. Nat Methods. 2016 Mar.

Abstract

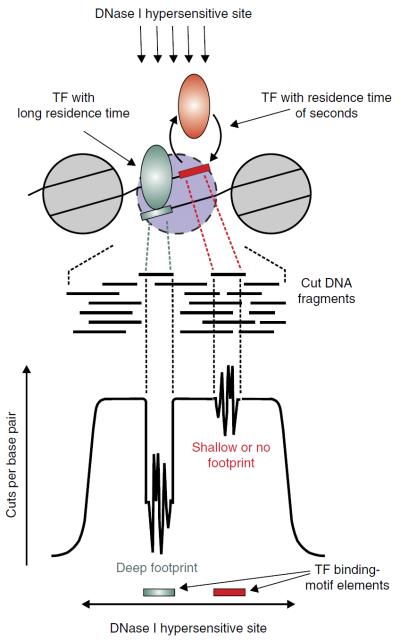
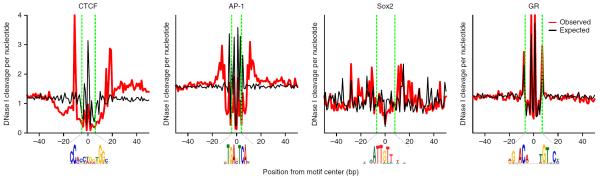
High-throughput sequencing technologies have allowed many gene locus-level molecular biology assays to become genome-wide profiling methods. DNA-cleaving enzymes such as DNase I have been used to probe accessible chromatin. The accessible regions contain functional regulatory sites, including promoters, insulators and enhancers. Deep sequencing of DNase-seq libraries and computational analysis of the cut profiles have been used to infer protein occupancy in the genome at the nucleotide level, a method introduced as 'digital genomic footprinting'. The approach has been proposed as an attractive alternative to the analysis of transcription factors (TFs) by chromatin immunoprecipitation followed by sequencing (ChIP-seq), and in theory it should overcome antibody issues, poor resolution and batch effects. Recent reports point to limitations of the DNase-based genomic footprinting approach and call into question the scope of detectable protein occupancy, especially for TFs with short-lived chromatin binding. The genomics community is grappling with issues concerning the utility of genomic footprinting and is reassessing the proposed approaches in terms of robust deliverables. Here we summarize the consensus as well as different views emerging from recent reports, and we describe the remaining issues and hurdles for genomic footprinting.


Figures

Figure 1
Figure 1
DHSs versus TF footprints. An accessible regulatory chromatin region is identified as a DHS enriched for sequencing reads in DNase-seq data. In the DHS, one or more narrow regions may be detected as putative TF footprints with evidence of local protection from DNase cleavage. The identity of TFs is inferred from the sequence patterns corresponding to the protected regions. Represented here are two example TFs with different DNA-binding dynamics that influence the degree of protection from DNase cleavage at the binding sites. The DNase cut signatures can be present over motif elements with deep, very shallow or no footprints.
Figure 2
Figure 2
Comparison of observed and DNA-intrinsic cut profiles averaged over motif elements bound by TFs. The observed cut profiles were computed using the average raw DNase cut counts over the cognate motif elements bound by the TF (in ChIP-seq peaks). The expected profiles were generated as defined by Stergachis et al.—that is, by taking the average DNA hexamer frequencies from the cut counts in naked DNA digestion data using the hexamers centered at each base-pair position. The CTCF, AP-1 and glucocorticoid receptor (GR) profiles were generated using DNase-seq and ChIP-seq data from mouse mammary cell line 3134 (ref. 8). The Sox2 profile for mouse embryonic stem cells was generated using the ENCODE DNase-seq (University of Washington) data, and ChIP-exo (chromatin immunoprecipitation followed by exonuclease digestion) data. PWMs of CTCF, AP-1 and GR were derived by motif discovery in ChIP-seq peaks using the MEME software. The Sox2 PWM was obtained from UniPROBE (http://the_brain.bwh.harvard.edu/uniprobe) using the homologous motif entry (SOX18_PRIMARY) for Sox18. We used FIMO with a P value of <10−4 to scan the mouse reference genome (NCBI 37/mm9) and find the motif elements for each PWM.
Figure 3
Figure 3
DNase sequence-bias-corrected profiles showing the correlation between footprint depth and TF binding residence time in vivo. The TFs are ordered by their reported DNA binding residence times from single-molecule microscopy studies. For each TF, the ratio of observed to expected profiles (Fig. 2) is plotted on the log2 scale. Black dashed lines mark where the observed cut levels are the same as the expected. Dark red dashed lines show the depth of the footprint induced by the TF (the 10% trimmed mean of the log-ratio profile over the motif region extended by 2 bp in both directions). The difference between the two dashed lines in each graph represents the footprint depth, which is smaller for TFs with shorter residence times.
Figure 4
Figure 4
The difficulty of assigning TFs on the basis of motif matches. The sets of genome-wide motif matches obtained using two similar but distinct PWMs have extensive overlap. The CREB1 elements were retrieved by scanning the mouse genome mm9 with FIMO and the top enriched PWM in phospho-CREB1 ChIP-seq peaks. The Jun elements were obtained by running FIMO on mm9 using the second enriched PWM from c-Jun ChIP-seq peaks (after the top enriched AP-1 motif). The ~159,000 motif elements matching either PWM cannot be matched to CREB1 or Jun dimers because many cell types express both factors and their biological functions are distinct.

References

    1. Tullius TD. Physical studies of protein-DNA complexes by footprinting. Annu. Rev. Biophys. Biophys. Chem. 1989;18:213–237. - PubMed
    1. Church GM, Ephrussi A, Gilbert W, Tonegawa S. Cell-type-specific contacts to immunoglobulin enhancers in nuclei. Nature. 1985;313:798–801. - PubMed
    1. Jackson PD, Felsenfeld G. A method for mapping intranuclear protein-DNA interactions and its application to a nuclease hypersensitive site. Proc. Natl. Acad. Sci. USA. 1985;82:2296–2300. - PMC - PubMed
    1. Hesselberth JR, et al. Global mapping of protein-DNA interactions in vivo by digital genomic footprinting. Nat. Methods. 2009;6:283–289. - PMC - PubMed
    1. Thurman RE, et al. The accessible chromatin landscape of the human genome. Nature. 2012;489:75–82. - PMC - PubMed

Publication types