

Development of the Intestinal RNA Virus Community of Healthy Broiler Chickens
- PMID: 26914580
- PMCID: PMC4767880
- DOI: 10.1371/journal.pone.0150094
Development of the Intestinal RNA Virus Community of Healthy Broiler Chickens
Abstract
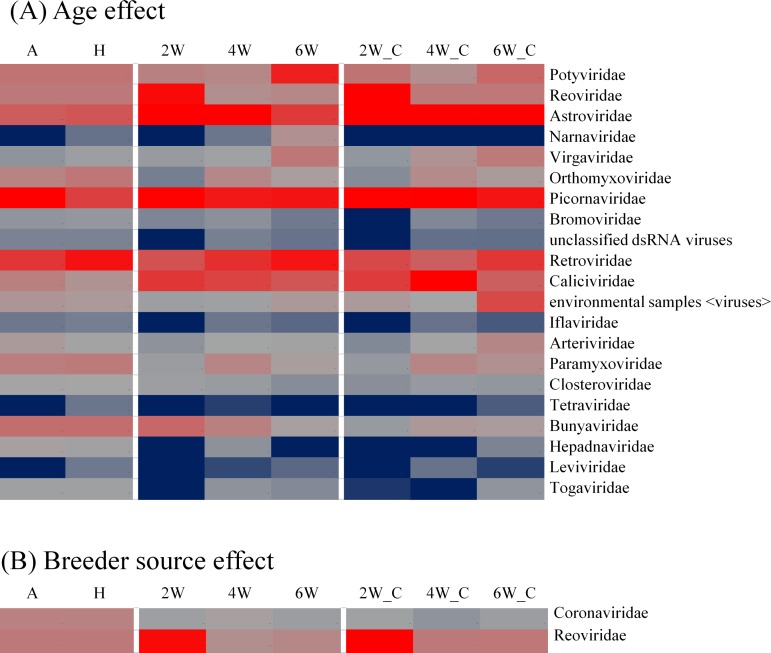
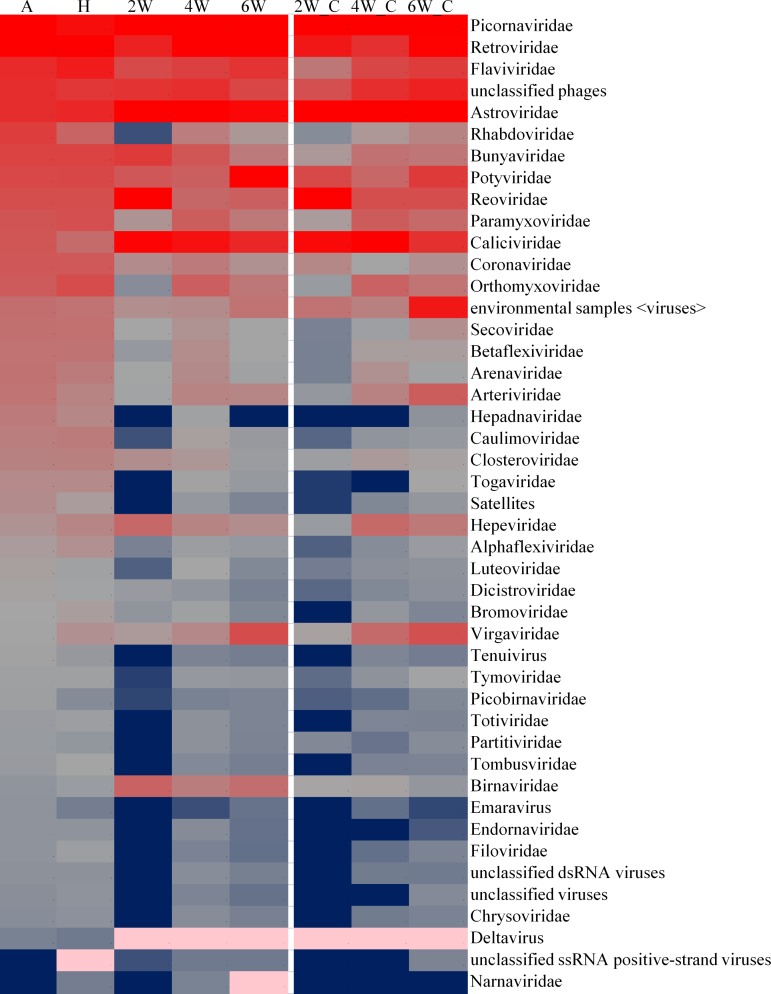
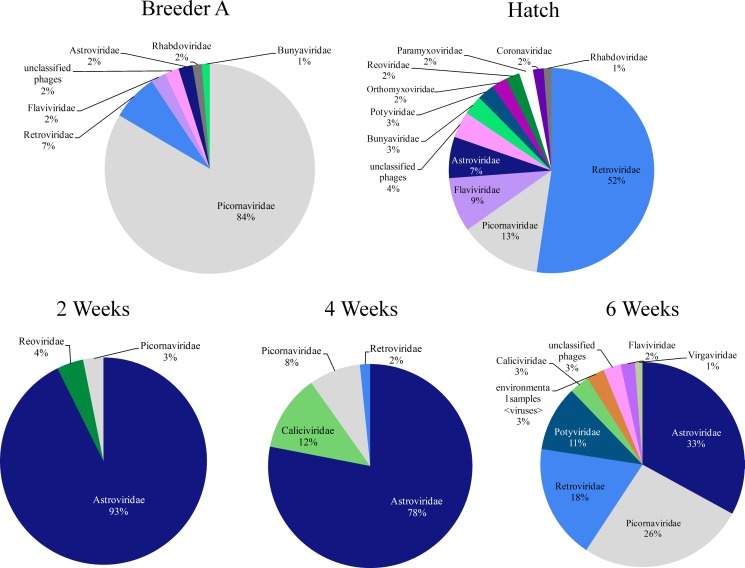
Several RNA viruses such as astrovirus, rotavirus, reovirus and parvovirus have been detected in both healthy and diseased commercial poultry flocks. The aim of this study was to characterize (a) the development of the RNA viral community in the small intestines of healthy broiler chickens from hatch through 6 weeks of age (market age) and (b) the contribution of the breeder source vs. bird age in development of the community structure. Intestinal tissue samples were harvested from breeders and their progeny, processed for viral RNA extraction and sequenced using Illumina Hiseq sequencing technology resulting in 100 bp PE reads. The results from this study indicated that the breeder source influenced the RNA viral community only at hatch but later environment i.e. bird age had the more significant effect. The most abundant RNA viral family detected at 2, 4 and 6 weeks of age was Astroviridae, which decreased in abundance with age while the abundance of Picornaviridae increased with age.
Conflict of interest statement
Figures

Similar articles
-
A metagenomic comparison of endemic viruses from broiler chickens with runting-stunting syndrome and from normal birds.Avian Pathol. 2016 Dec;45(6):616-629. doi: 10.1080/03079457.2016.1193123. Epub 2016 Oct 4. Avian Pathol. 2016. PMID: 27215546 Free PMC article.
-
Simultaneous detection of astrovirus, rotavirus, reovirus and adenovirus type I in broiler chicken flocks.Pol J Vet Sci. 2012;15(2):337-44. doi: 10.2478/v10181-012-0052-0. Pol J Vet Sci. 2012. PMID: 22844713
-
Viral metagenomic analysis of chickens with runting-stunting syndrome in the Republic of Korea.Virol J. 2020 Apr 15;17(1):53. doi: 10.1186/s12985-020-01307-z. Virol J. 2020. PMID: 32293477 Free PMC article.
-
Enteric viruses detected by molecular methods in commercial chicken and turkey flocks in the United States between 2005 and 2006.Avian Dis. 2008 Jun;52(2):235-44. doi: 10.1637/8174-111507-Reg.1. Avian Dis. 2008. PMID: 18646452
-
Recent progress in the characterization of avian enteric viruses.Avian Dis. 2013 Sep;57(3):573-80. doi: 10.1637/10390-092712-Review.1. Avian Dis. 2013. PMID: 24283121 Review.
Cited by
-
An Insight into the Molecular Characteristics and Associated Pathology of Chicken Astroviruses.Viruses. 2022 Mar 30;14(4):722. doi: 10.3390/v14040722. Viruses. 2022. PMID: 35458451 Free PMC article. Review.
-
Occurrence and Role of Selected RNA-Viruses as Potential Causative Agents of Watery Droppings in Pigeons.Pathogens. 2020 Dec 6;9(12):1025. doi: 10.3390/pathogens9121025. Pathogens. 2020. PMID: 33291258 Free PMC article. Review.
-
A metagenomic investigation of the faecal RNA virome structure of asymptomatic chickens obtained from a commercial farm in Durban, KwaZulu-Natal province, South Africa.BMC Genomics. 2024 Jun 24;25(1):629. doi: 10.1186/s12864-024-10517-6. BMC Genomics. 2024. PMID: 38914944 Free PMC article.
-
Molecular characterization of chicken astrovirus and pathogenicity of a novel isolate in China.Front Microbiol. 2023 Dec 11;14:1280313. doi: 10.3389/fmicb.2023.1280313. eCollection 2023. Front Microbiol. 2023. PMID: 38149277 Free PMC article.
-
Cross-sectional survey of selected enteric viruses in Polish turkey flocks between 2008 and 2011.BMC Vet Res. 2017 Apr 14;13(1):108. doi: 10.1186/s12917-017-1013-8. BMC Vet Res. 2017. PMID: 28410608 Free PMC article.
References
-
- Shah JD, Baller J, Zhang Y, Silverstein K, Xing Z, Cardona CJ (2014) Comparison of tissue sample processing methods for harvesting the viral metagenome and a snapshot of the RNA viral community in a turkey gut. Journal of virological methods 209: 15–24. 10.1016/j.jviromet.2014.08.011 - DOI - PMC - PubMed
-
- Ciarlet M, Estes MK (2001) Interactions between rotavirus and gastrointestinal cells. Curr Opin Microbiol 4: 435–441. - PubMed
-
- Dhama K, Saminathan M, Karthik K, Tiwari R, Shabbir MZ, Kumar N, et al. (2015) Avian rotavirus enteritis—an updated review. Vet Q: 1–17. - PubMed
Publication types
MeSH terms
Substances
LinkOut - more resources
Full Text Sources
Other Literature Sources
