. 2016 Feb 25;12(2):e1005442.
doi: 10.1371/journal.ppat.1005442. eCollection 2016 Feb.

Nitric Oxide Protects against Infection-Induced Neuroinflammation by Preserving the Stability of the Blood-Brain Barrier

Affiliations

Nitric Oxide Protects against Infection-Induced Neuroinflammation by Preserving the Stability of the Blood-Brain Barrier

Gabriela C Olivera et al. PLoS Pathog. .

Abstract

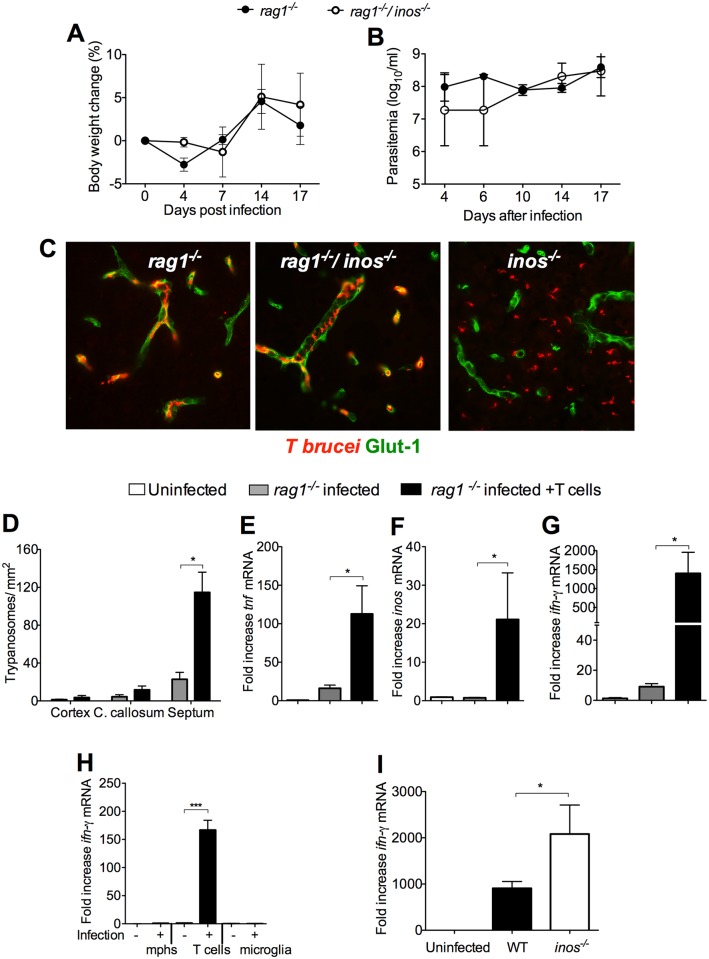
Nitric oxide (NO) generated by inducible NO synthase (iNOS) is critical for defense against intracellular pathogens but may mediate inflammatory tissue damage. To elucidate the role of iNOS in neuroinflammation, infections with encephalitogenic Trypanosoma brucei parasites were compared in inos(-/-) and wild-type mice. Inos(-/-) mice showed enhanced brain invasion by parasites and T cells, and elevated protein permeability of cerebral vessels, but similar parasitemia levels. Trypanosome infection stimulated T cell- and TNF-mediated iNOS expression in perivascular macrophages. NO nitrosylated and inactivated pro-inflammatory molecules such as NF-κΒp65, and reduced TNF expression and signalling. iNOS-derived NO hampered both TNF- and T cell-mediated parasite brain invasion. In inos(-/-) mice, TNF stimulated MMP, including MMP9 activity that increased cerebral vessel permeability. Thus, iNOS-generated NO by perivascular macrophages, strategically located at sites of leukocyte brain penetration, can serve as a negative feed-back regulator that prevents unlimited influx of inflammatory cells by restoring the integrity of the blood-brain barrier.


Conflict of interest statement

The authors have declared that no competing interests exist.

Figures

Fig 1
Fig 1. iNOS-derived NO reduces T.b. brucei and leukocyte penetration into the brain.
(A-B) Body weight and parasitemia of WT and inos -/- mice infected i.p. with 2x10³ T.b. brucei. Each point represents the mean log10 parasites per ml ± SEM (n = 9 to 10 per group). Statistically significant differences in comparison with infected WT animal (*p< 0.05, **p< 0.01 two-way ANOVA). The body weights were standardized with respect to the mean of the same group before infection. One out of three independent experiments is depicted. (C-F) The mean number of T.b. brucei (C), and CD4+ (D), and CD8+ (E) T cells per mm2 ± SEM from 6 animals per group is depicted. (F) Representative immunofluorescence images show T.b. brucei and cerebral endothelial cells in cerebral regions of WT and inos -/- mice 25 dpi. A representative of three similar independent experiments is shown. Statistically significant differences in comparison to WT mice at the same dpi: (*p<0.05, **p<0.01 and ***p<0.001 unpaired Student’s t test). (G) Representative fluorescent staining of CD45+ leukocytes and cerebral endothelial cells (Glut-1) of WT and inos -/- mice 25 dpi. (H, I) Parasitemia (H) and weight (I) of inos -/- mice infected i.p. with T. brucei and treated or not daily with 3.5 mg GSNO i.p. starting at 5 dpi. (J-L) The mean numbers of T.b. brucei (J), CD4+ (K) and CD8+ (L) cells per mm2 in the brain of mice (n = 6 per group) sacrificed 23 dpi is shown (*p<0.05, **p<0.01 and ***p<0.001 unpaired Student’s t test).
Fig 2
Fig 2. iNOS expression is associated with integrity of the BBB during infection with T.b. brucei.
(A, D, F) IgG (A) and fibrin (D) immunolabeling and Evan’s blue extravasation (F) in the brains of WT and inos -/- mice 23 dpi with T.b. brucei. (B, E, G) The mean relative integrated fluorescence densities (RIF) of IgG (B), fibrin (E) or EB (G) ± SEM in the brain parenchyma from at least 3 sections per brain and 4 animals per group are depicted. (C) IgG was also detected by Western Blot in brain lysates of inos -/- mice 25 dpi with T.b. brucei but not in infected or uninfected WT mice. Differences between WT and inos -/- mice are significant (*p<0.05 unpaired Student’s t test).
Fig 3
Fig 3. iNOS is expressed by perivascular macrophages in the brain during infection with T.b. brucei.
(A) Concentration of NO3 in plasma as measured by Griess assay after nitrate reductase reaction. The mean NO3 concentration ± SEM in the plasma of infected mice (n = 5 per time point) is depicted. Differences with uninfected controls are significant (**p<0.01, ***p<0.001, unpaired Student’s t test). (B) Levels of S-nitrosylated molecules in plasma as measured using the 2,3-diaminonapthalene (DAN) assay. The mean relative fluorescence units (RFU) ± SEM in WT and inos -/- infected and control animals are indicated. Differences with uninfected control and inos -/—infected mice are significant (**p<0.01, unpaired Student’s t test). (C) The accumulation of inos or hprt transcripts in brains sampled at various dpi with T.b. brucei was measured by real time PCR. The mean fold inos mRNA increase ± SEM in brains from infected mice (n ≥ 5 per group) is depicted. Differences with controls are significant (*p<0.05; ***p<0.001, unpaired Student’s t test). (D) Levels of S-nitrosylated proteins in brain lysates from T.b. brucei infected mice were measured by the biotin switch assay as described in the supplemental methods (S1 Text). GAPDH was used as a loading control. Similar results were obtained in 3 independent experiments. (E) iNOS labelling in the brain of WT mice at 0 or 30 dpi with T.b. brucei. (F) Immunolabelling with the activated microglia marker Iba-1 in a WT mouse. (G) FACS analysis of CD45highCD11b+ macrophages (R1), CD45dim CD11b+ microglia (R2) and CD45high CD11b- lymphocytes (R3) in the brain of WT mice was determined at 0 or 25 dpi. (H) The frequency of iNOS+ cells in gated populations (panel G) are depicted. Cells from inos -/- infected mice were used as negative controls. (I) The mean percentage ± SEM of iNOS+ CD45high CD11b+ or CD45dim CD11b+ (n = 4 per group) is depicted. (J) Levels of inos transcripts in sorted CD45highCD11b+, CD45dimCD11b+ and CD45high CD11b- populations are shown. Three mice were pooled for each determination and at least 4 independent determinations were performed.
Fig 4
Fig 4. Tnf mRNA is increased in brains of inos -/- mice infected with T.b. brucei.
(A) The total RNA was extracted from brains of WT and inos -/- T.b. brucei-infected mice sacrificed 23 dpi or uninfected controls. (B) In other sets of experiments RNA was also isolated from infected inos -/- mice treated daily with GSNO starting 5 dpi. The mean fold tnf mRNA increase ± SEM in brains from infected mice (n ≥ 4 per group) was calculated by real time PCR. (C) Tnf mRNA in sorted macrophage, microglia and T cell-enriched brain cell populations of T.b. brucei-infected and uninfected WT mice. Differences with controls are significant (*p<0.05, **p<0.01 Student’s t test). (D) Inos mRNA levels were measured in triplicate cultures of WT BMM at different time points after stimulation with T.b. brucei lysates (MOI 5:1) or 1 μg/ ml LPS. Differences with controls are significant (*p<0.05, ***p<0.001 Student t test). (E) Nitrosylated proteins in lysates obtained before and after LPS-stimulation of WT and inos -/- BMM were detected by the biotin switch assay. GAPDH was used as a loading control. One of 3 independent experiments is shown. (F, G) The concentration of TNF in supernatants of LPS-stimulated BMM treated or not with 200 μM GSNO were measured by ELISA. The mean TNF titters in triplicate cultures ± SEM are depicted. Differences with LPS-stimulated inos -/- BMM are significant (*p<0.05, ***p<0.001 Student’s t test). (H) The levels of mmp9 mRNA were determined in BMM lysates 24 h after incubation with 100 ng/ ml TNF in presence or not of GSNO. Differences are significant (**p<0.01 Student’s t test). (I) Immunofluorescence of NF-κΒ p65 (red) and DAPI in LPS-stimulated BMM treated or not with GSNO. (J, K) Detection of NF-κΒ p65 in lysates of nitrosylated proteins from LPS-stimulated BMM (J) and of brains of T.b. brucei-infected mice (K). The biotin switch reaction was performed on lysates, which were then immunoprecipitated with neutroavidin agarose. NF-κΒ p65 in the IP was then detected in a WB (see S1 Text). The levels of total NF-κΒp65 were used as loading controls.
Fig 5
Fig 5. iNOS protects against TNF-mediated penetration of T.b. brucei into the brain.
(A, B) Mean body weight and log10 parasites per ml of inos -/-/ tnfr1 -/-, tnfr1 -/-, inos -/- and WT mice infected with T.b. brucei ± SEM (n = 10 per group). The body weights are relative to the weight of each group before infection. Differences with infected WT animals are significant (*p<0.05, **p< 0.01 two-way ANOVA). One of two independent experiments is depicted. (C-E) The mean number of T.b. brucei (C), CD4+ (D), CD8+ T cells (E) cells per mm2 in the cerebral regions of mice at 23 dpi ± SEM (n = 6). One out of two independent experiments is depicted. Differences with WT mice at the same dpi are significant (*p< 0.05, **p< 0.01, ***p<0.001 unpaired Student’s t test). (F) IgG was detected by Western blot in brain lysates of tnfr1 -/-, inos -/- /tnfr1 -/-and inos -/- mice 23 dpi with T.b. brucei. (G) Accumulation of inos mRNA increase ± SEM in brains from WT and tnfr1 -/- mice at 23 dpi (n ≥ 5 per group) was calculated. Differences with controls are significant (**p<0.01 Student’s t test). (H) The concentration of NO2 was measured in the 24 h supernatants of LPS-stimulated WT and tnfr1 -/- BMM using a Griess assay. The mean NO2 levels ± SEM in triplicate cultures per condition are depicted. Differences with WT control are significant (***p<0.001 Student’s t test).
Fig 6
Fig 6. MMP9 mediates vascular leakage and parasite penetration into the brain of T.b. brucei-infected inos -/- mice.
(A, C) The mean fold increase of mmp mRNA ± SEM (n ≥ 5 per group) was measured in RNA from the brain of mice 23 dpi or uninfected controls by real time PCR. One of two independent experiments is shown. Differences with controls are significant (*p<0.05, **p<0.01 Student’s t test). (B) MMP activity in brain lysates from infected mice was determined using a fluorescent MMP FRET peptide substrate. The mean relative fluorescent units (RFU) ± SEM of 4 animals per group are depicted. Differences with uninfected mice are significant (*p<0.05 Student’s t test). (D, E) RNA was obtained from LPS stimulated or control WT, inos -/- and tnfr1 -/- BMM and from inos -/- BMM treated or not with GSNO. The mean fold increase of mmp9 mRNA in triplicate cultures ± SEM is depicted. (F, G) Mean weight and log10 parasites per ml of WT and inos -/- mice (n = 10 per group) infected with T.b. brucei and treated or not i.p. with minocycline. Differences to the WT group are significant (*p<0.05 ANOVA). (H-J) The mean number of T.b. brucei (H), CD4+ (I), CD8+ T cells (J) cells per mm2 in the cerebral regions of inos -/- mice treated or not with minocycline at 23 dpi ± SEM (n = 5 per group). (K) Immunofluorescence micrograph from the cortex showing T.b. brucei (upper micrographs 63x) or IgG (lower 25x) at 23 dpi treated or not with minocycline. (L) IgG in brain lysates of infected inos -/- mice treated or not with minocycline was detected by Western blot. (M, N) Total RNA was extracted from the brains of T.b. brucei-infected WT mice treated or not with minocycline at 23 dpi. The mean fold increase of mmp9 (M) and tnf (N) mRNA ± SEM in brains from infected mice (n ≥ 5 per group) was determined. Differences with controls are significant (*p<0.05 Student’s t test). (O, P) Mmp9 and tnf mRNA were measured in lysates from LPS stimulated inos -/- BMM in presence of various concentrations of minocycline. Differences with untreated controls are significant (**p<0.01 Student’s t test). (Q) MMP activity in supernatants from LPS treated BMM in presence or absence of minocycline was determined using a fluorescent MMP FRET peptide substrate. The mean RFU ± SEM in triplicate cultures are depicted. Differences to untreated BMM are significant (*p<0.05, **p<0.01 ***p<0.001 Student’s t test).
Fig 7
Fig 7. iNOS hampers T cell-mediated parasite penetration into the brain parenchyma.
(A, B) Mean body weight and log10 parasites per ml ± SEM of rag1 -/-/ inos -/- and rag1 -/- mice (n = 9–10) infected with T.b. brucei. (C) Representative immunofluorescence images from the septal nuclei showing T.b. brucei in red and cerebral endothelial cells in green of rag1 -/-, rag1 -/-/ inos -/- and inos -/- mice at 22 dpi. (D) Quantification of T.b. brucei invasion in the cerebral regions rag1 -/- mice inoculated or not with 5 x10⁶ CD90+ T cells i.v. 7 days before infection with T.b. brucei. The mean number of parasites ± SEM (n = 6 per group) in T cell inoculated and non-transferred controls in one of two independent experiments is depicted. The accumulation of tnf (E), inos (F) and ifng (G) transcripts in infected and T cell-transferred rag1 -/- mice and controls at 23 dpi. The mean fold of mRNA increase ± SEM in brains from infected mice (n ≥ 5 per group) was calculated. Differences with controls are significant (*p<0.05 Student’s t test). (H) RNA was extracted from FACS sorted from macrophage-, microglia- and T cell-enriched brain populations from T. brucei-infected and control mice as described in materials and methods. The mean fold ifng mRNA increase ± SEM of 4 independent pools per group is depicted. (I) The mean fold increase of ifng mRNA ± SEM in RNA from brains from infected WT or inos -/- and uninfected mice (n ≥ 4 per group) was measured. Differences with controls are significant (***p<0.001 Student’s t test).
Fig 8
Fig 8. Graphical summary.
In wild type mice, T.b. brucei infection stimulates the expression of TNF and IFN-γ by macrophages and T cells respectively (1). T cells and TNF are required for brain invasion (2), but are also non-redundant stimulators of iNOS expression in perivascular macrophages (3). iNOS-derived NO harnessed the expression of and the response to TNF, and T cell mediated brain invasion by parasites and leukocytes (4). Nitrosylation of intracellular signalling molecules such as NF-κΒ p65 might lead to diminished TNF release and signalling (4). In the absence of iNOS (right panel), TNF levels increased resulting in an amplified MMP9 expression (3) that mediates the BBB breakdown followed by vascular leakage and an uncontrolled penetration of T cells and parasites into the brain.

References

    1. Bogdan C Nitric oxide synthase in innate and adaptive immunity: an update. Trends Immunol. 2015; 36: 161–178. 10.1016/j.it.2015.01.003 - DOI - PubMed
    1. Thiel VE, Audus KL Nitric oxide and blood-brain barrier integrity. Antioxid Redox Signal. 2001; 3: 273–278. - PubMed
    1. Smith KJ, Lassmann H The role of nitric oxide in multiple sclerosis. Lancet Neurol. 2002; 1: 232–241. - PubMed
    1. Cauwels A, Van Molle W, Janssen B, Everaerdt B, Huang P, Fiers W, et al. Protection against TNF-induced lethal shock by soluble guanylate cyclase inhibition requires functional inducible nitric oxide synthase. Immunity. 2000; 13: 223–231. - PubMed
    1. Dumas M, Bisser S (1999) Clinical aspects of human African trypanosomiasis In: Dumas M, Bouteille B, Buguet A, editors. Progress in human African trypanosomiasis, sleeping sickness. Paris: Springer; pp. 215–233.

Publication types

MeSH terms