. 2016 Aug;23(8):1312-21.
doi: 10.1038/cdd.2016.9. Epub 2016 Feb 26.

Histone deacetylase inhibition reveals a tumor-suppressive function of MYC-regulated miRNA in breast and lung carcinoma

Affiliations

Histone deacetylase inhibition reveals a tumor-suppressive function of MYC-regulated miRNA in breast and lung carcinoma

C M Adams et al. Cell Death Differ. 2016 Aug.

Abstract

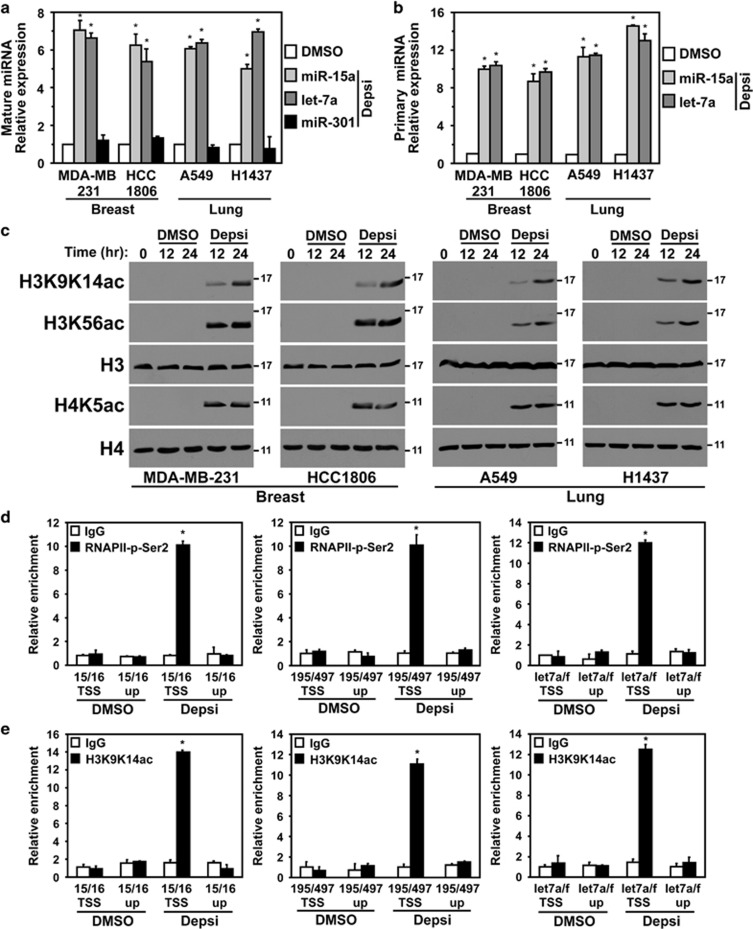
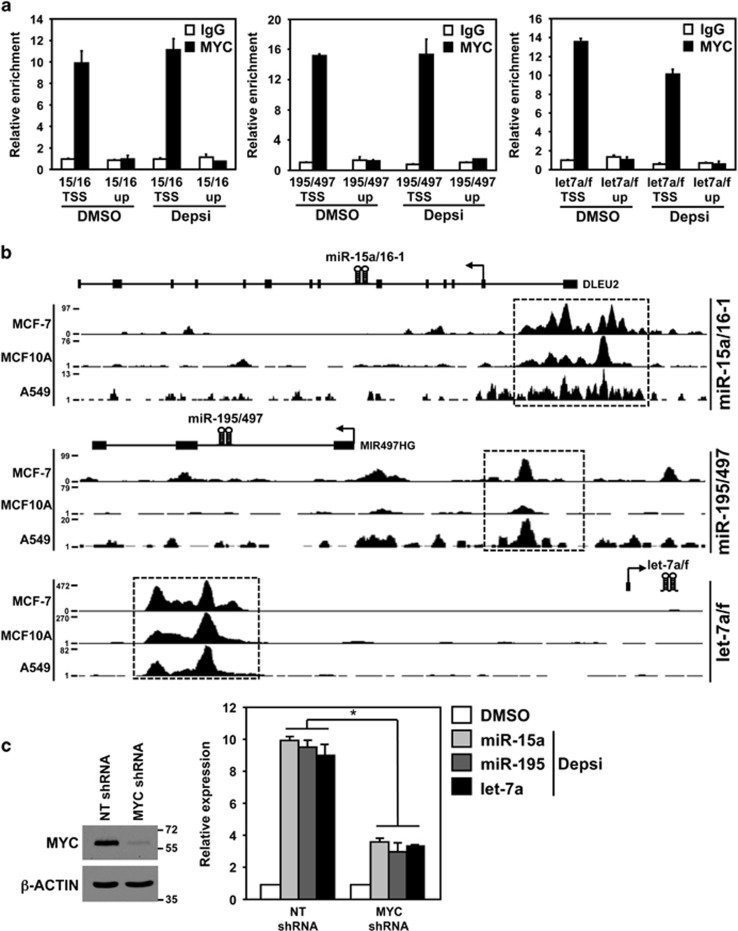
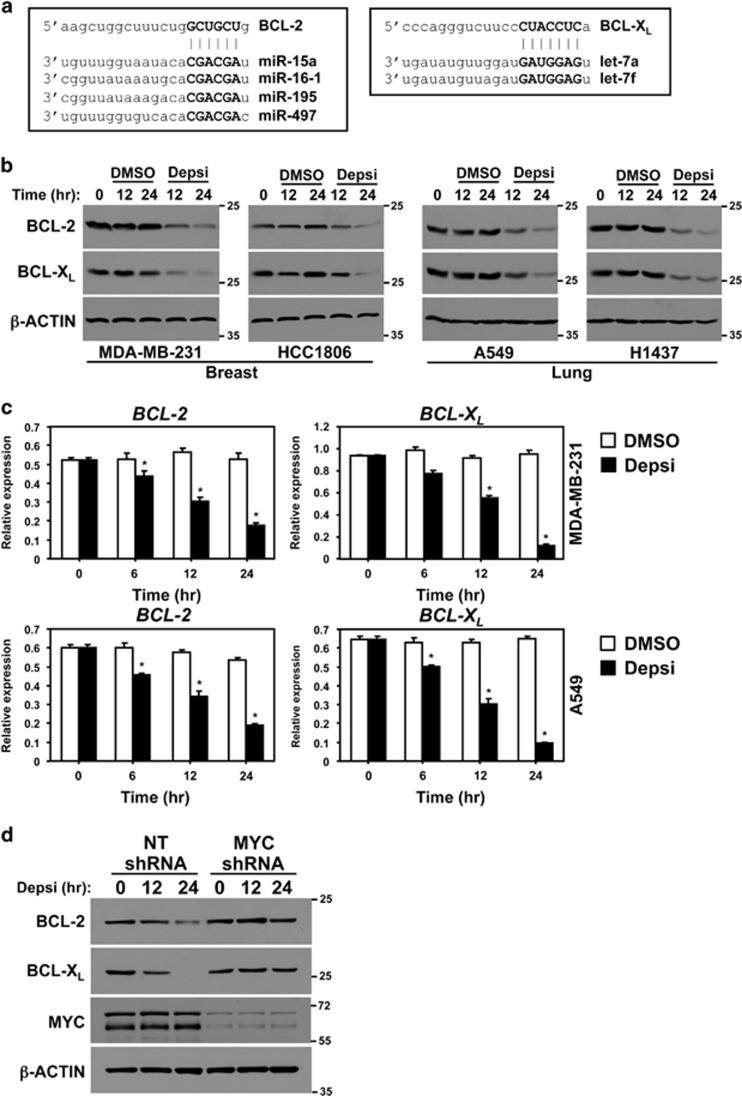
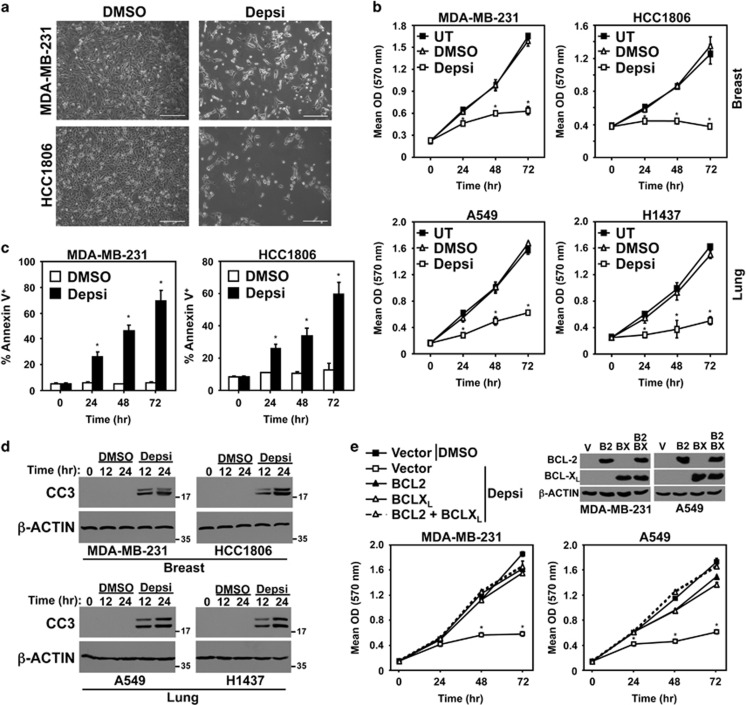
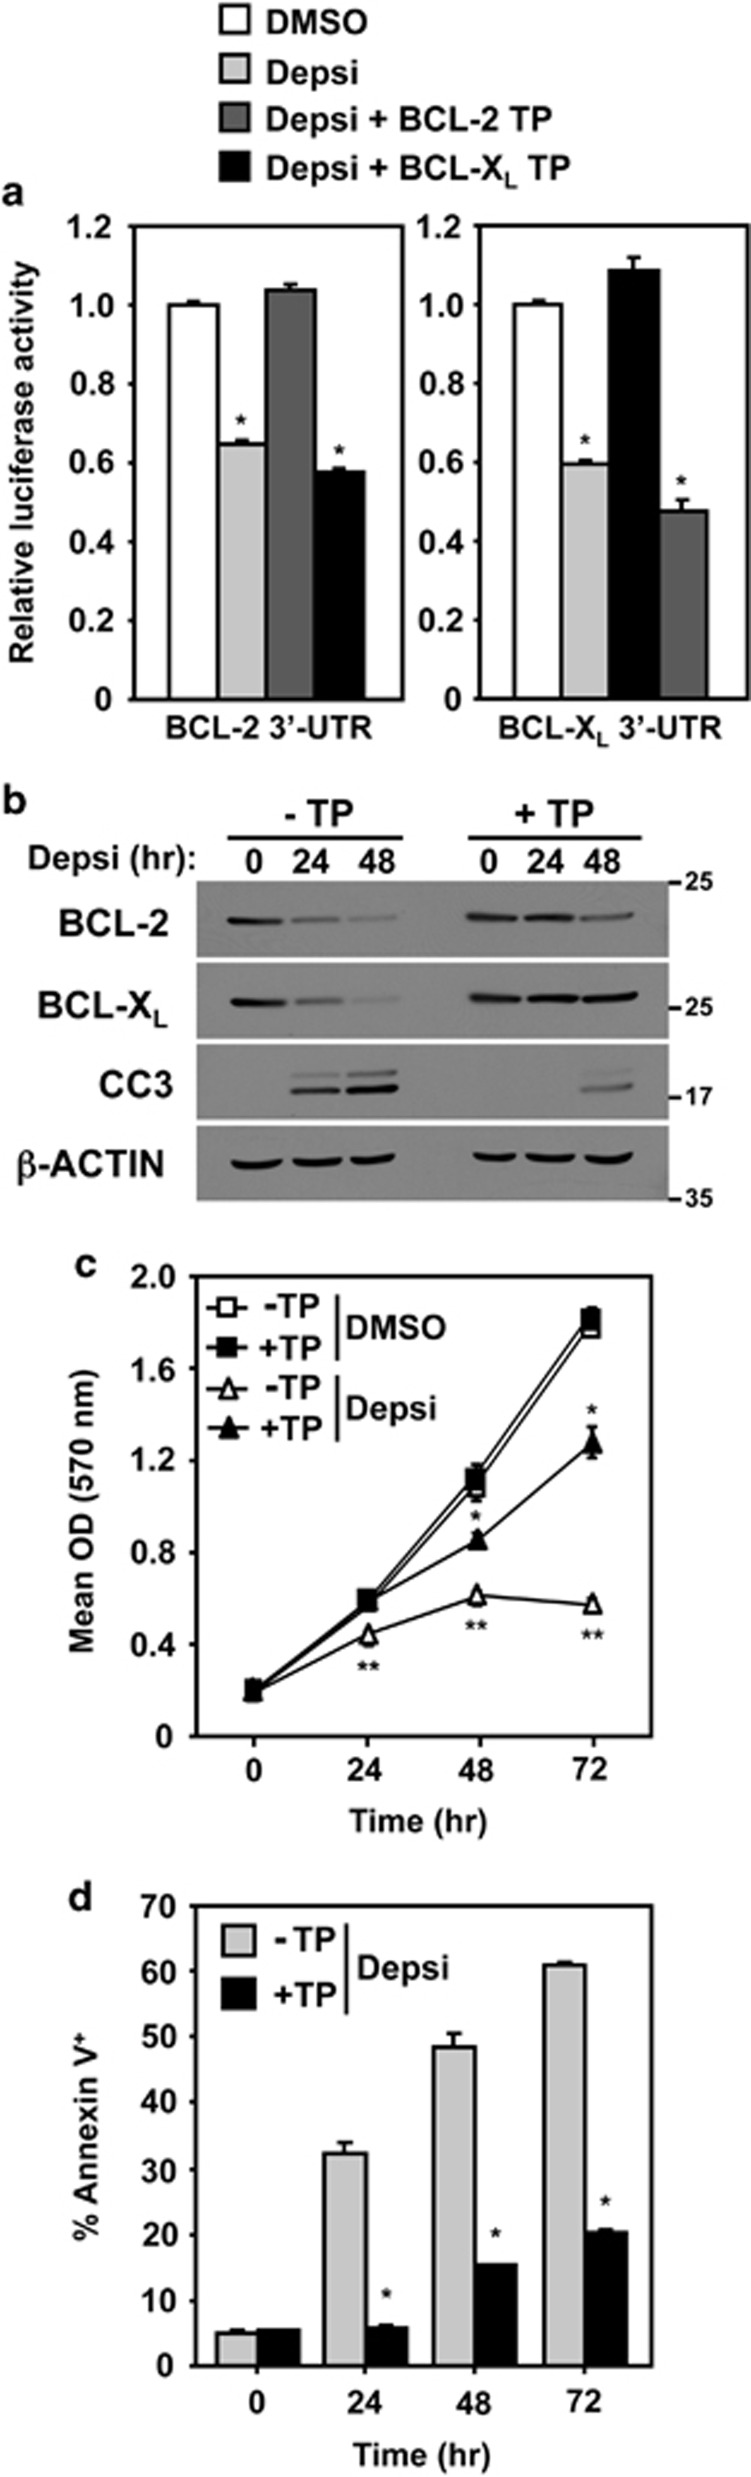
Histone deacetylase (HDAC) inhibition leads to dynamic changes in the epigenetic landscape that is postulated to alter the expression of critical mediators of cellular proliferation and death. While current HDAC inhibitors have shown to be efficacious in the treatment of specific hematologic malignancies, their therapeutic utility in epithelial-based cancers warrants further evaluation. Moreover, the mechanisms of HDAC inhibition-induced cancer cell death are not completely understood. Therefore, elucidation of the underlying pathways engaged by HDAC inhibition may enable the development of more effective therapeutic strategies. Here, we report that HDAC inhibition in human breast and lung carcinoma cells activates an apoptotic mechanism mediated by microRNA (miRNA) and induced by the oncogene MYC. Specifically, following HDAC inhibition, MYC, which normally represses miR-15 and let-7 families, transcriptionally activated their expression and MYC was required for this miRNA upregulation. As a result, transcript levels of the tumor-suppressive miR-15 and let-7 families increased, which targeted and decreased the expression of the crucial prosurvival genes BCL-2 and BCL-XL, respectively. MYC was also required for the downregulation of BCL-2 and BCL-XL following HDAC inhibition. Blocking the binding sites of the miR-15 and let-7 families in the 3'-untranslated regions of BCL-2 and BCL-XL protected against HDAC inhibition-induced apoptosis. These results provide important insight into the molecular underpinnings of HDAC inhibition-induced cell death in breast and lung cancer and reveal a tumor-suppressive role for MYC-regulated miRNA that is activated with HDAC inhibition.


Figures

Figure 1
Figure 1
miR-15 and let-7 families are transcriptionally upregulated following HDACi. Human breast (MDA-MB-231, HCC1806) and lung (A549, H1437) carcinoma cell lines were treated with vehicle control (DMSO) or Depsi. (a and b) Following 12 h with Depsi or DMSO, levels of the indicated mature miRNA (a) and primary miRNA (b) were determined by quantitative real-time-PCR (qRT-PCR) (triplicates) and normalized to small RNA RNU6b levels. Values for each miRNA are plotted relative to their respective DMSO sample, which was set at 1 (only 1 bar for the DMSO-treated samples is displayed.) (c) Western blot analysis of the indicated proteins at intervals following Depsi or DMSO vehicle control. Molecular weight (kilodalton) is indicated. (d and e) MDA-MB-231 breast cancer cells were treated with Depsi or DMSO for 4 h. ChIP with anti-RNAPII-phosphorylated on serine 2 (RNAPII-p-Ser2; d), H3K9K14ac (e) or isotype controls (immunoglobulin G (IgG)) was performed followed by qRT-PCR (triplicates) for the indicated promoter regions (transcriptional start site (TSS)) or the upstream regions (up; negative controls). Values are relative to input DNA and their respective IgG controls and plotted relative to the first DMSO sample, which was set at 1. Error bars for (a, b, d and e) are S.E.M.; (a and b) *P<0.002 and (d and e) *P<0.0015 were determined by comparison with DMSO control (t-tests)
Figure 2
Figure 2
MYC is required to transcriptionally upregulate the miR-15 and let-7 families upon HDACi. (a) MDA-MB-231 breast carcinoma cells were treated for 4 h with Depsi or vehicle control (DMSO). Following ChIP with antibodies against MYC or isotype control (immunoglobulin G (IgG)), quantitative real-time-PCR (qRT-PCR) for the indicated promoter regions (transcriptional start site (TSS)) or the upstream (up) regions MYC does not bind (negative controls) was performed (triplicates). Values are relative to input DNA and their respective IgG controls and plotted relative to the first DMSO sample, which was set at 1. (b) Evaluation of ENCODE MYC ChIP-sequencing data. Peaks demonstrate MYC enrichment at the promoter of the miR-15a/16-1, miR-195/497 and let-7a/f clusters (boxed) in breast adenocarcinoma (MCF-7), immortalized mammary epithelial cells (MCF10A) and lung adenocarcinoma (A549) cells. (c) MDA-MB-231 cells were transfected with a vector encoding either a MYC-specific shRNA or an NT shRNA control. MYC protein levels were evaluated by western blot 48 h after shRNA transfection (left). Molecular weight (kilodalton) is indicated. Relative expression of the indicated miRNA was determined by qRT-PCR (triplicates) following 12 h of HDACi with Depsi or DMSO (right). miRNA levels were normalized to the expression of small RNA RNU6b. Values for each miRNA are plotted relative to their respective DMSO sample, which was set at 1 (only 1 bar for the DMSO-treated samples is displayed.) Error bars are S.E.M.; *P<0.01 (t-tests)
Figure 3
Figure 3
MYC mediates HDACi-induced decrease of BCL-2 and BCL-XL protein expression. (a) Diagram of the miR-15 family and let-7 family binding site within the 3′-UTR of BCL-2 and BCL-XL, respectively. miRNA seed sequence is given in bold. (b) Western blots for the indicated proteins were performed with whole-cell protein lysates of the indicated human breast and lung carcinoma cell lines following the addition of vehicle control (DMSO) or Depsi for the indicated time. (c) BCL-2 and BCL-XL mRNA levels were evaluated by quantitative real-time-PCR (qRT-PCR) (normalized to β-ACTIN levels) in MDA-MB-231 and A549 cells at intervals following the addition of DMSO or Depsi. Error bars are S.E.M.; *P<0.03 was determined by comparison with DMSO (t-tests). (d) MDA-MB-231 cells were transfected with a vector encoding a MYC-specific shRNA or an NT shRNA control. Forty-eight hours after transfection, cells were treated with Depsi for the indicated time and western blots for the indicated proteins were performed. Molecular weight (kilodalton) is indicated
Figure 4
Figure 4
HDACi induces apoptosis of breast and lung cancer cells. (a) Following addition of Depsi or vehicle control (DMSO) to MDA-MB-231 and HCC1806 cells, representative microscopic images were taken 72 h later (× 10 objective; line denotes 200 microns). (b–d) The indicated human breast and lung carcinoma cells remained untreated (UT) or were treated with DMSO or Depsi. MTT assays were performed (quadruplicates) every 24 h (b). Annexin-V positivity (triplicates) was measured at intervals by flow cytometry (c). At intervals, cleaved caspase-3 (CC3) was assessed by western blot (d); molecular weight is indicated in kilodaltons. (e) MDA-MB-231 and A549 cells were transfected with empty vector (V) or vectors encoding BCL-2 (B2) and/or BCL-XL (BX). Western blots were performed for the indicated proteins. Cells were treated with DMSO or Depsi and MTT assays performed (quadruplicates) every 24 h. Error bars are S.D.; *P<0.01 for (b) and *P<0.003 for (c) were determined by comparison with DMSO; *P<0.01 for (e) was determined by comparison with vector control cells treated with DMSO (t-tests)
Figure 5
Figure 5
Blocking miR-15 and let-7 families from binding BCL-2 and BCL-XL protects from HDACi-induced apoptosis. MDA-MB-231 breast cancer cells were transiently transfected with Target Protectors (TP) that block the miR-15 family and let-7 family binding sites in the BCL-2 and BCL-XL 3′-UTR, respectively. (a) A luciferase expression vector containing the 3′-UTR of BCL-2 or BCL-XL was also transfected into MDA-MB-231 cells. Luciferase activity was measured (triplicates) after 24 h with vehicle control (DMSO) or Depsi. (b) Following the addition of Depsi for the indicated intervals, total cell protein lysates from MDA-MB-231 with (+TP) or without (−TP) TPs were western blotted for the indicated proteins; cleaved caspase-3 (CC3). Molecular weight (kilodalton) is indicated. (c and d) Cells with (+TP) or without (−TP) the BCL-2 and BCL-XL TPs were subjected to MTT assay (quadruplicates; c) and Annexin-V analysis (triplicates; d) by flow cytometry at intervals following the addition of Depsi or DMSO. Error bars are S.D. For (a) *P<0.003 and for (c) *P<0.01 and **P<0.001 were determined by comparison with DMSO; for (d), *P<0.02 was determined by comparison with cells without TPs (t-tests)

References

    1. Hanahan D, Weinberg RA. Hallmarks of cancer: the next generation. Cell 2011; 144: 646–674. - PubMed
    1. Dawson MA, Kouzarides T. Cancer epigenetics: from mechanism to therapy. Cell 2012; 150: 12–27. - PubMed
    1. West AC, Johnstone RW. New and emerging HDAC inhibitors for cancer treatment. J Clin Invest 2014; 124: 30–39. - PMC - PubMed
    1. Xu WS, Parmigiani RB, Marks PA. Histone deacetylase inhibitors: molecular mechanisms of action. Oncogene 2007; 26: 5541–5552. - PubMed
    1. Zhang X, Zhao X, Fiskus W, Lin J, Lwin T, Rao R et al. Coordinated silencing of MYC-mediated miR-29 by HDAC3 and EZH2 as a therapeutic target of histone modification in aggressive B-cell lymphomas. Cancer Cell 2012; 22: 506–523. - PMC - PubMed

Publication types

MeSH terms