. 2016 Mar 29;133(13):1249-63.
doi: 10.1161/CIRCULATIONAHA.115.020502. Epub 2016 Feb 25.

Drp1-Dependent Mitochondrial Autophagy Plays a Protective Role Against Pressure Overload-Induced Mitochondrial Dysfunction and Heart Failure

Affiliations

Drp1-Dependent Mitochondrial Autophagy Plays a Protective Role Against Pressure Overload-Induced Mitochondrial Dysfunction and Heart Failure

Akihiro Shirakabe et al. Circulation. .

Abstract

Background: Mitochondrial autophagy is an important mediator of mitochondrial quality control in cardiomyocytes. The occurrence of mitochondrial autophagy and its significance during cardiac hypertrophy are not well understood.

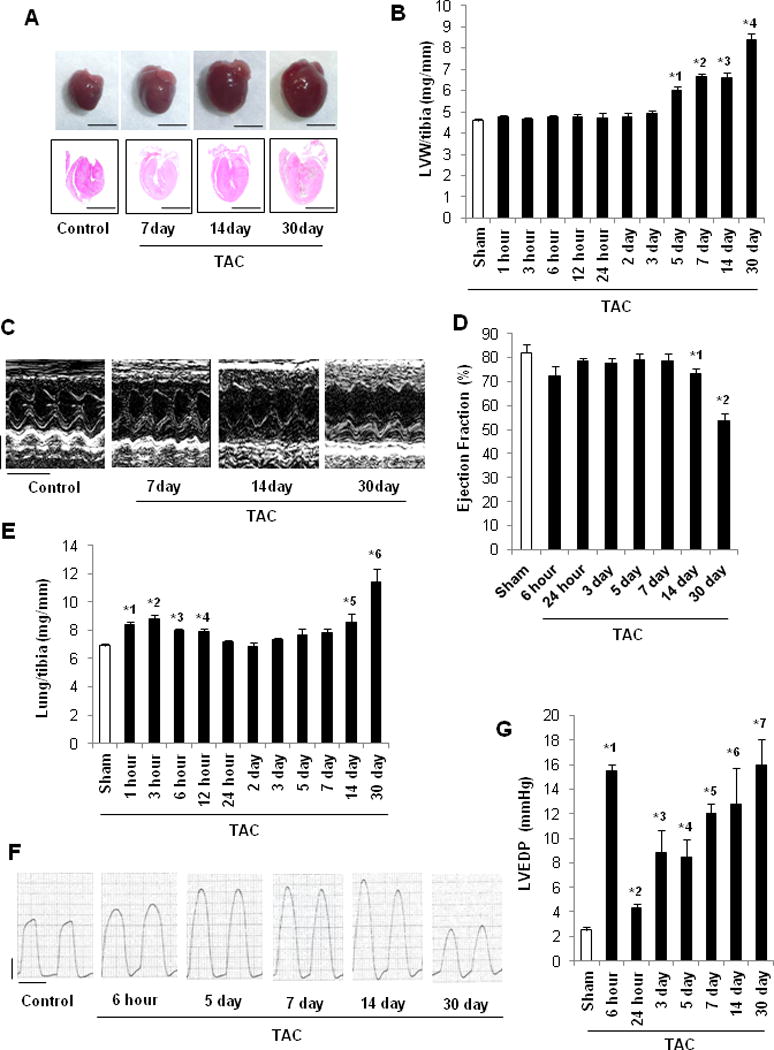
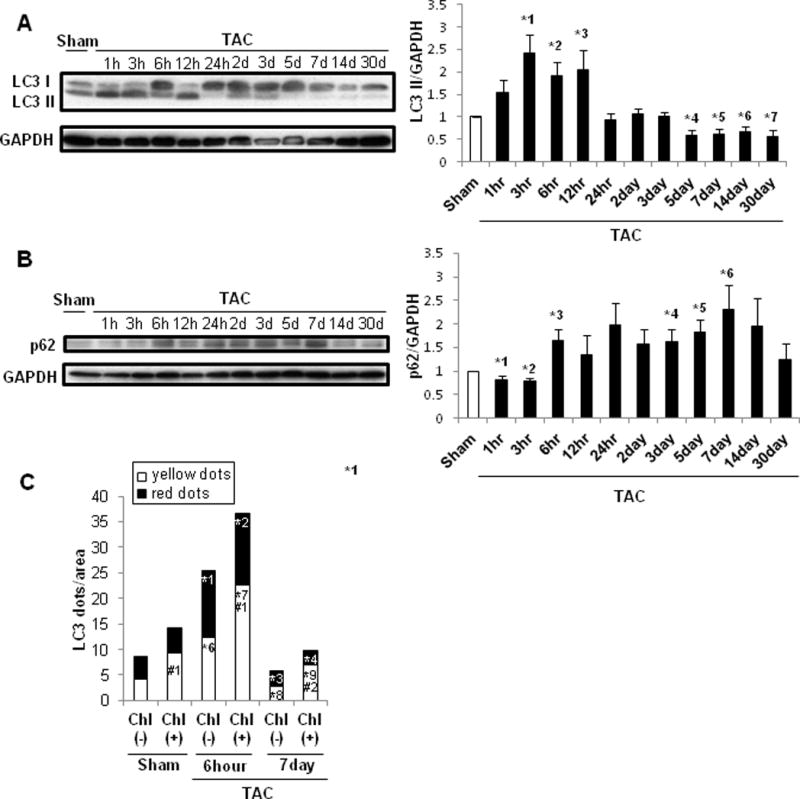
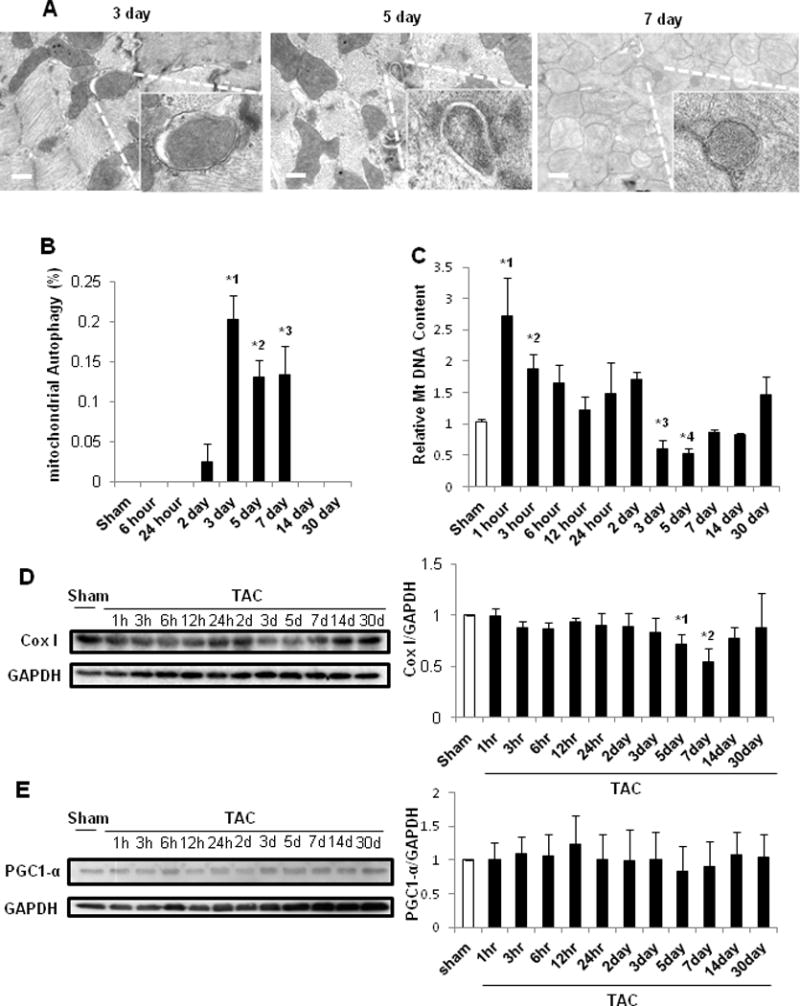
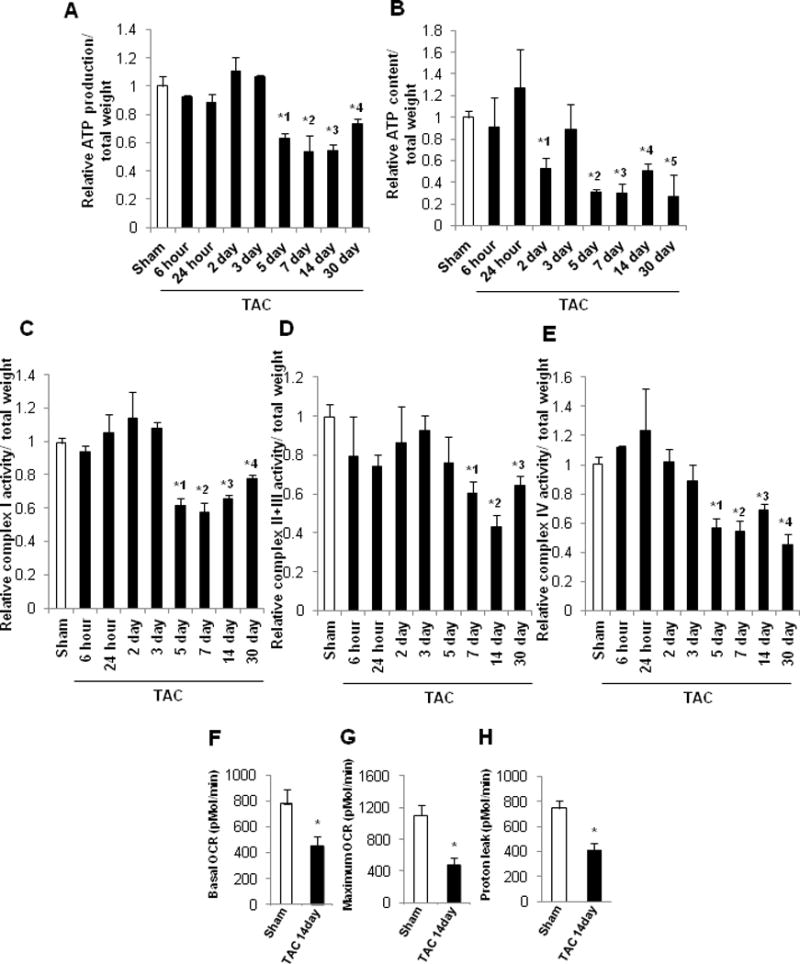
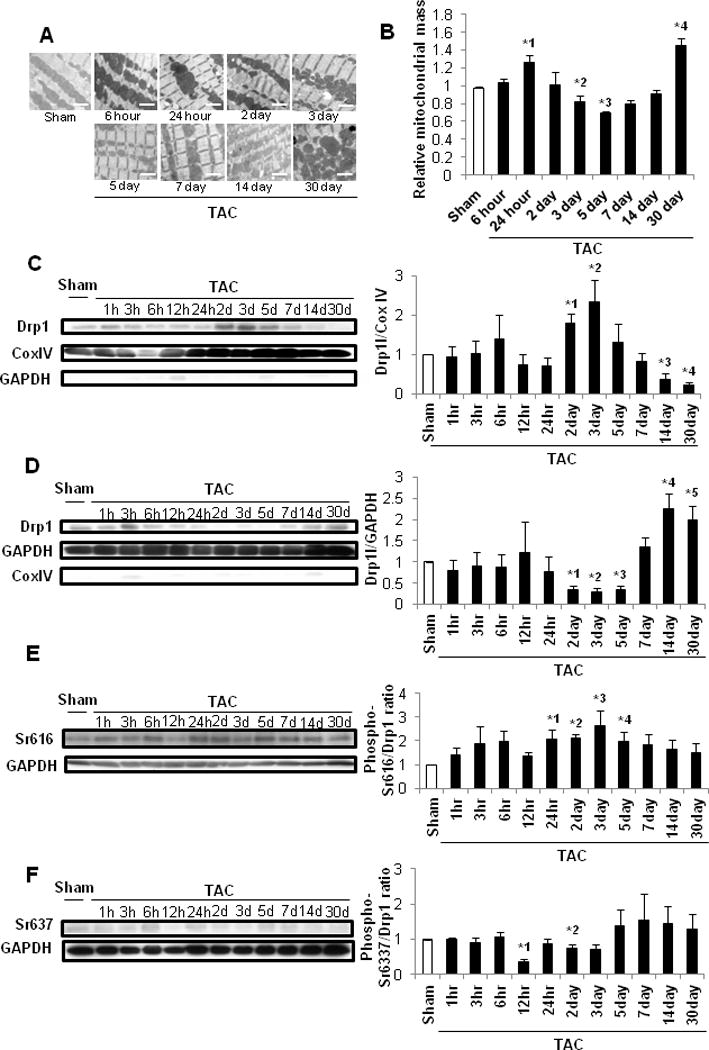
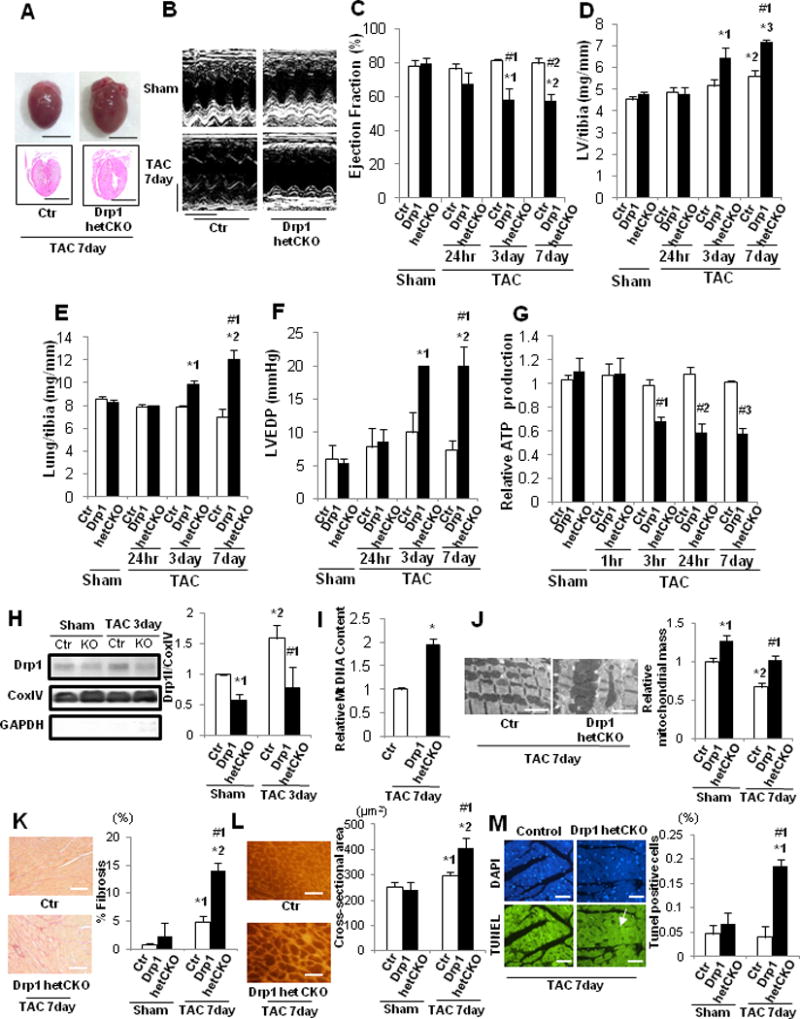
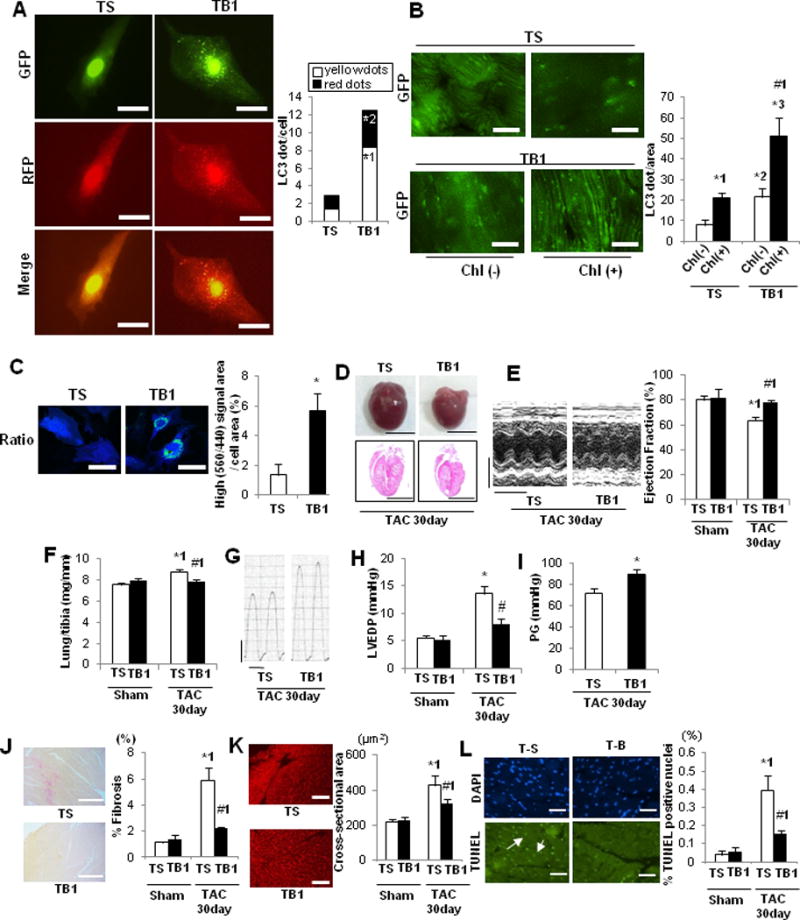
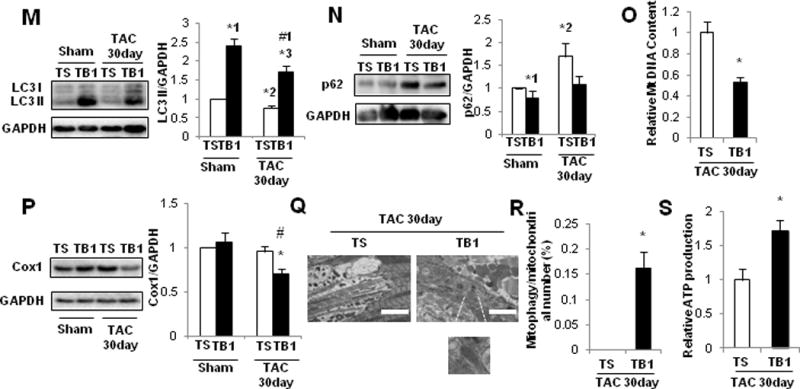
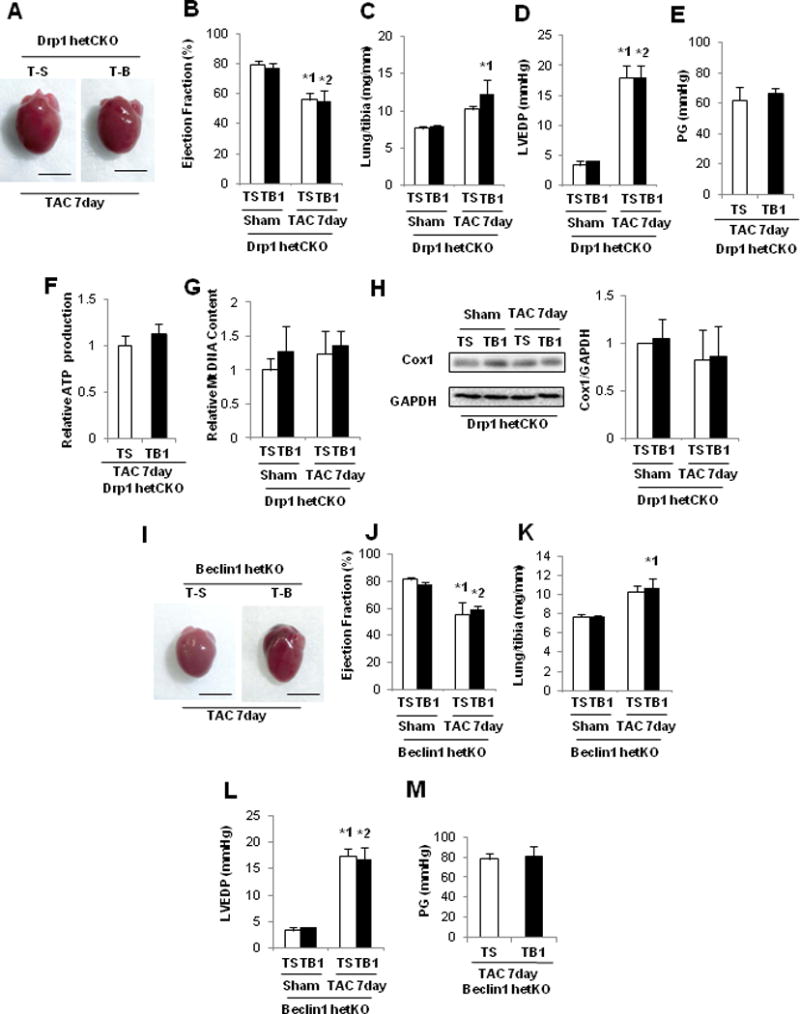
Methods and results: Mice were subjected to transverse aortic constriction (TAC) and observed at multiple time points up to 30 days. Cardiac hypertrophy developed after 5 days, the ejection fraction was reduced after 14 days, and heart failure was observed 30 days after TAC. General autophagy was upregulated between 1 and 12 hours after TAC but was downregulated below physiological levels 5 days after TAC. Mitochondrial autophagy, evaluated by electron microscopy, mitochondrial content, and Keima with mitochondrial localization signal, was transiently activated at ≈3 to 7 days post-TAC, coinciding with mitochondrial translocation of Drp1. However, it was downregulated thereafter, followed by mitochondrial dysfunction. Haploinsufficiency of Drp1 abolished mitochondrial autophagy and exacerbated the development of both mitochondrial dysfunction and heart failure after TAC. Injection of Tat-Beclin 1, a potent inducer of autophagy, but not control peptide, on day 7 after TAC, partially rescued mitochondrial autophagy and attenuated mitochondrial dysfunction and heart failure induced by overload. Haploinsufficiency of either drp1 or beclin 1 prevented the rescue by Tat-Beclin 1, suggesting that its effect is mediated in part through autophagy, including mitochondrial autophagy.

Conclusions: Mitochondrial autophagy is transiently activated and then downregulated in the mouse heart in response to pressure overload. Downregulation of mitochondrial autophagy plays an important role in mediating the development of mitochondrial dysfunction and heart failure, whereas restoration of mitochondrial autophagy attenuates dysfunction in the heart during pressure overload.

Keywords: Drp1 protein, mouse; autophagy; hypertrophy; mitochondria.


Figures

Figure 1
Figure 1
Cardiac function of C57BL/6J mice after PO. In A–C and E, C57BL/6J mice were subjected to either sham operation (n=43) or TAC for 1, 3, 6, 12 or 24 hours, or 2, 3, 5, 7, 14 or 30 days (n=8, 7, 12, 8, 7, 8, 18, 11, 13, 12, and 27, respectively). In D, mice were subjected to either sham operation (n=6) or TAC for 6 or 24 hours, or 2, 3, 5, 7, 14 or 30 days (n=7, 6, 6, 6, 6, 8, 8, and 8, respectively). A. Gross morphology and longitudinal heart sections of C57BL/6J mice stained with HE. Scale bars, 5.0 mm. B. LV weight to TL (LV/tibia) ratio. * p<0.05 vs. sham at each time point. *1 p<0.001, *2 p<0.001, *3 p<0.001, *4 p<0.001. C. Representative echocardiographs. Scale bars, vertical 2.5 mm and horizontal 250 ms. D. LVEF, evaluated by echocardiography. * p<0.05 vs. sham at each time point. *1 p=0.047, *2 p<0.001. E. Lung weight to TL (lung/tibia) ratio. * p<0.05 vs. sham at each time point. *1 p<0.001, *2 p=0.004, *3 p<0.001, *4 p<0.001, *5 p=0.045, *6 p=0.025. In F–G, mice were subjected to either sham operation (n=16) or TAC for 6 or 24 hours, or 3, 5, 7, 14 or 30 days (n=6, 6, 5, 8, 6, 5, and 6, respectively). F. Representative LV pressure wave forms. Scale bars, vertical 40 mmHg and horizontal 100 ms. G. LVEDP, evaluated with hemodynamic measurements. * p<0.05 vs. sham at each time point. *1 p<0.001, *2 p=0.001, *3 p=0.027, *4 p=0.004, *5 p<0.001, *6 p=0.025, *7 p=0.001.
Figure 2
Figure 2
Autophagy was upregulated in the early phase but downregulated in the chronic phase of PO. C57BL/6J mice were subjected to either sham operation (n=43) or TAC for 1, 3, 6, 12 or 24 hours, or 2, 3, 5, 7, 14 or 30 days (n= 4, 4, 4, 4 4, 4, 4, 4, 3, 4, and 4, respectively). A. Representative immunoblots and quantitative analysis of whole-cell heart homogenates for LC3 and GAPDH. * p<0.05 vs. sham-operated mice. *1 p=0.018, *2 p=0.018, *3 p=0.049, *4 p=0.007, *5 p=0.012, *6 p=0.032, *7 p=0.035. B. Representative immunoblots and quantitative analysis of whole-cell heart homogenates for p62 and GAPDH. * p<0.05 vs. sham-operated mice. *1 p=0.043, *2 p=0.015, *3 p=0.032, *4 p=0.044, *5 p=0.016, *6 p=0.031. C. Bar graph indicates mean number of autophagosomes (yellow dots) and autolysosomes (red dots) per cell. Chl: Chloroquine. * p<0.05 vs. sham operation, # p<0.05 vs. Chl (-) at each time point. Data were obtained from 3 experiments. *1 p=0.008, *2 p<0.001, *3 p=0.031, *4 p=0.049, *5 p=0.001, *6 p=0.010, *7 p=0.001, *8 p=0.022, *9 p=0.004,#1 p=0.041,#2 p<0.001.
Figure 3
Figure 3
Mitophagy was upregulated 3 days after PO. In A–B, C57BL/6J mouse hearts were examined by EM after sham operation (n=16) or TAC (n=4, 4, 3, and 4 for 6 hours, and 5, 7, and 30 days, respectively). A. Representative EM images of C57BL/6J mouse hearts after TAC. Insets show mitophagy, seen only 3, 5 and 7 days after TAC. Scale bar, 500 nm. B. Bar graphs indicate the number of autophagosomes containing mitochondria per total number of mitochondria. * p<0.05 vs. sham operation. *1 p=0.003, *2 p=0.004, *3 p=0.018. C. Relative mitochondrial DNA content after TAC. C57BL/6J mice were subjected to either sham operation (n=43) or TAC for 1, 3, 6, 12 or 24 hours, or 2, 3, 5, 7, 14 or 30 days (n= 4, 4, 4, 4, 3, 4, 4, 8, 7, 4, and 4, respectively). * p<0.05 vs. sham operation. *1 p=0.025, *2 p=0.044, *3 p=0.040, *4 p=0.043. In D–E, C57BL/6J mice were subjected to either sham operation (n=4) or TAC for 1, 3, 6, 12 or 24 hours, or 2, 3, 5, 7, 14 or 30 days (n= 4, 4, 4, 4, 4, 4, 4, 4, 3, 4, and 4, respectively). D. Representative immunoblots and quantitative analysis of whole-cell heart homogenates for Cox I and GAPDH. * p<0.05 vs. sham operation. *1 p=0.030, *2 p=0.015. E. Representative immunoblots and quantitative analysis of whole-cell heart homogenates for PCG1α and GAPDH.
Figure 4
Figure 4
Time course of mitochondrial function in the mouse heart after PO. In A–E, the values from sham-operated mouse hearts at each time point were averaged and expressed as 1. * p<0.05 vs. sham at each time point. In A–B, C57BL/6J mice were subjected to either sham operation (n=34) or TAC for 6 or 24 hours, or 2, 3, 5, 7, 14 or 30 days (n=4, 4, 4, 4, 4, 6, 4, and 4, respectively). A. Relative mitochondrial ATP production in the mouse heart. *1 p=0.021, *2 p=0.027, *3 p=0.009, *4 p=0.025. B. Relative mitochondrial ATP content in the mouse heart. *1 p=0.036, *2 p=0.029, *3 p=0.001, *4 p=0.049, *5 p=0.043. In C–E, C57BL/6J mice were subjected to either sham operation (n=29) or TAC for 6 or 24 hours, or 2, 3, 5, 7, 14 or 30 days (n=4, 4, 3, 4, 3, 3, 4, and 4, respectively). C. Relative respiratory chain complex I activity in mitochondria. *1 p=0.043, *2 p=0.032, *3 p=0.007, *4 p=0.022. D. Relative respiratory chain complex II+III activity in mitochondria. *1 p=0.022, *2 p=0.003, *3 p=0.004. E. Relative respiratory chain complex IV activity in mitochondria. *1 p=0.014, *2 p=0.012, *3 p=0.014, *4 p=0.002. In F–H, mice were subjected to either sham operation (n=5) or 14 days of TAC (n=4). The mitochondrial fraction prepared from heart homogenates was subjected to Seahorse analyses. * p<0.05 vs. sham at 14 days. F. Basal respiration.* p=0.013 vs. sham at 14 days. G. Maximal respiration.* p=0.006 vs. sham at 14 days. H. Proton leak.* p=0.004 vs. sham at 14 days.
Figure 5
Figure 5
Mitochondrial morphology and mitochondrial translocation of Drp1 after PO. In A–B, C57BL/6J mice were subjected to either sham operation (n =32) or TAC for 1, 3, 6, 12 or 24 hours, or 2, 3, 5, 7, 14 or 30 days (n= 4, 4, 4, 4, 4, 4, 4, 4, 3, 4, and 4, respectively). A. EM images of C57BL/6J mouse hearts after TAC. Scale bar, 2 μm. B. Mitochondrial mass in control mouse hearts is expressed as 1. * p<0.05 vs. sham at each time point. *1 p=0.048, *2 p=0.047, *3 p=0.027, *4 p=0.010. In C–F, C57BL/6J mice were subjected to either sham operation (n =4) or TAC for 1, 3, 6, 12 or 24 hours, or 2, 3, 5, 7, 14 or 30 days (n= 4, 4, 4, 4, 4, 4, 4, 4, 3, 4, and 4, respectively). C. Representative immunoblots and quantitative analysis of Drp1, GAPDH and Cox IV in the mitochondrial fraction prepared from heart homogenates. * p<0.05 vs. sham. *1 p=0.013, *2 p=0.040, *3 p=0.007, *4 p<0.001. D. Representative immunoblots and quantitative analysis of Drp1, GAPDH and Cox IV in the cytosolic fraction prepared from heart homogenates. *1 p<0.001, *2 p<0.001, *3 p<0.001, *4 p=0.013, *5 p=0.023. In E–F, whole-cell heart homogenates were subjected to immunoblot analyses. Representative immunoblots and quantitative analyses are shown. E. Drp1 Ser616 phosphorylation. *1 p=0.026, *2 p=0.001, *3 p=0.048, *4 p=0.049. F. Drp1 Ser637 phosphorylation. *1 p<0.001, *2 p=0.049.
Figure 6
Figure 6
HF and mitochondrial dysfunction after PO were exacerbated in cardiac-specific Drp1 heterozygous knockout mice. Drp1-hetCKO mice were subjected to either sham operation (n=20) or TAC for 1, 3, 6, or 24 hours, or 3 or 7 days (n=3, 3, 3, 3, 3 and 9, respectively). A. Representative gross morphology and longitudinal heart sections of Drp1-hetCKO and control mice stained with HE 7 days after TAC. Scale bars, 5.0 mm. B. Representative echocardiographs. Scale bars, horizontal 250 ms and vertical 2.5 mm. In C–G, * p<0.05 vs. sham operation at each time point, # p<0.05 vs. control in each group. C. LVEF, evaluated by echocardiography. *1 p=0.045, *2 p=0.014,#1 p=0.007,#2 p=0.001. D. LV weight to TL (LV/tibia) ratio. *1 p=0.001, *2 p=0.027, *3 p<0.003,#1 p=0.003. E. Lung weight to TL (lung/tibia) ratio. *1 p=0.036, *2 p=0.015,#1 p<0.001. F. LVEDP, evaluated by hemodynamic measurement. *1 p=0.008, *2 p=0.004,#1 p=0.003. G. Relative mitochondrial ATP content in the mouse heart.#1 p=0.014,#2 p=0.004,#3 p=0.006. H. Representative immunoblots and quantitative analysis of Drp1, GAPDH, and Cox IV. Mice were subjected to either TAC or sham operation for 3 days. Mitochondrial fractions prepared from the heart homogenates were subjected to immunoblot analyses. * p<0.05 vs. control in sham group, # p<0.05 vs. control in sham and TAC. *1 p=0.036, *2 p=0.019,#1 p=0.007. I. Relative mitochondrial DNA content in Drp1-hetCKO mice after 7 days of TAC. * p=0.048 vs. control group. J. Representative EM images of Drp1-hetCKO and control mouse hearts after TAC and quantitative analysis of mitochondrial mass. Scale bar, 2 μm. Mitochondrial mass in control mouse hearts is expressed as 1. * p<0.05 vs. control in sham group, # p<0.05 vs. control in sham and TAC. *1 p=0.012, *2 p=0.025,#1 p=0.043. K. PASR staining to assess cardiac fibrosis. * p<0.05 vs. control in sham group, # p<0.05 vs. control in sham and TAC. Scale bar, 200 μm. *1 p=0.025, *2 p=0.001,#1 p=0.009. L. WGA staining to assess CM cross-sectional area. * p<0.05 vs. control in sham group, # p<0.05 vs. control in sham and TAC. Scale bar, 500 μm. *1 p=0.041, *2 p=0.003,#1 p=0.010. M. TUNEL staining to assess apoptosis in CMs. # p<0.05 vs. control in sham and TAC. Scale bar, 50 μm. *1 p=0.005,#1 p=0.012.
Figure 7
Figure 7
TB1 attenuates mitochondrial dysfunction and development of HF after PO. A. Cultured CMs were transduced with Ad-tf-LC3 and then treated with TB1 or TS. Representative images of mRFP-GFP-LC3 puncta. Red puncta indicate autolysosomes, whereas yellow puncta indicate autophagosomes. Scale bar, 50 μm. The bar graph indicates mean numbers of autophagosomes and autolysosomes per cell obtained from 3 experiments. * p<0.05 vs. TS. *1 p=0.007, *2 p=0.048. B. Tg-GFP-LC3 mice were treated with TB1 or TS for 14 days. Mice were treated with chloroquine (10 mg/kg, ip) for 4 hours and then euthanized. Representative images of GFP-LC3 puncta. Chl: chloroquine. Bar graph indicates mean number of LC3 puncta per area. n= 3 (TS with Chl), 3 (TS without Chl), 3 (TB1 with Chl), and 3 (TB1 without Chl). * p<0.05 vs. TS, # p<0.05 Chl (+) vs. Chl (−) in each group. *1 p=0.009, *2 p=0.031, *3 p=0.002,#1 p=0.025. C. Cultured CMs were transduced with Ad-Keima-MLS and then treated with TB1 or TS. Representative images of Keima-MLS. Puncta with high 560/440 indicate mitochondrial autophagy. The ratio of the area of puncta with high 560/440 vs. the total cell area obtained from 3 experiments is shown. Scale bar, 50 μm. * p=0.037 vs. TS. In D–N, mice were subjected to either sham operation or TAC for 30 days. These mice were then treated daily with either TB1 (n=12) or TS (n=13) on Days 7–21 and euthanized on Day 30. D. Gross morphology and HE staining of longitudinal sections of the mouse hearts. Scale bars, 5.0 mm. E. Representative M-mode tracings of echocardiographs and LVEF. * p<0.05 vs. TS with sham operation, # p<0.05 vs. TS with 30 days TAC. Scale bars, horizontal 250 ms and vertical 2.5 mm. *1 p=0.003,#1 p<0.001. F. Lung weight to TL (lung/tibia) ratio. # p<0.05 vs. TS. *1 p=0.007,#1 p=0.001. G. Representative LV pressure wave forms. Scale bars, vertical 40 mmHg and horizontal 60 ms. H. LVEDP, evaluated by hemodynamic measurements. # p<0.05 vs. TS with 30 days TAC. * p=0.035, #p=0.034. I. Pressure gradient at TAC. *p=0.010 vs. TS. J. PASR staining to assess cardiac fibrosis. * p<0.05 vs. TS with sham operation, # p<0.05 vs. TS with 30 days TAC. Scale bar, 500 μm. *1 p=0.001,#1 p=0.005. K. WGA staining to assess CM cross-sectional area. * p<0.05 vs. TS with sham operation, # p<0.05 vs. TS with 30 days TAC. Scale bar, 200 μm. *1 p=0.009,#1 p=0.011. L. TUNEL staining to assess CM apoptosis. * p<0.05 vs. TS with sham operation, # p<0.05 vs. TS with 30 days TAC. Scale bar, 50 μm. *1 p=0.003,#1 p=0.028. In M–N, whole-cell heart homogenates were subjected to immunoblots. M. Representative immunoblots and quantitative analysis of LC3 and GAPDH. * p<0.05 vs. TS with sham operation. # p<0.05 vs. TS with 30 days TAC. *1 p=0.001, *2 p=0.030, *3 p=0.016,#1 p=0.002. N. Representative immunoblots and quantitative analysis of p62 and GAPDH. * p<0.05 vs. TS with sham operation. *1 p=0.012, *2 p=0.036. In O–S, mice were subjected to either sham operation (TS: n=3, TB: n=3) or TAC (TS: n=3, TB: n=3). O. Relative mitochondrial DNA content. * p=0.032 vs. TS. P. Representative immunoblots and quantitative analysis of whole-cell heart homogenates for Cox I and GAPDH. * p<0.05 vs. TS with sham operation, # p<0.05 vs. TS with 30 days TAC. * p=0.042, #p=0.013. Q. Representative EM images of the mouse heart. The inset shows autophagosomes containing mitochondria, observed only in TB1-treated mice. Scale bar, 2 μm. R. Bar graphs indicate the number of autophagosomes containing mitochondria per total number of mitochondria. * p=0.039 vs. sham operation. S. Relative mitochondrial ATP production. * p=0.034 vs. TS.
Figure 7
Figure 7
TB1 attenuates mitochondrial dysfunction and development of HF after PO. A. Cultured CMs were transduced with Ad-tf-LC3 and then treated with TB1 or TS. Representative images of mRFP-GFP-LC3 puncta. Red puncta indicate autolysosomes, whereas yellow puncta indicate autophagosomes. Scale bar, 50 μm. The bar graph indicates mean numbers of autophagosomes and autolysosomes per cell obtained from 3 experiments. * p<0.05 vs. TS. *1 p=0.007, *2 p=0.048. B. Tg-GFP-LC3 mice were treated with TB1 or TS for 14 days. Mice were treated with chloroquine (10 mg/kg, ip) for 4 hours and then euthanized. Representative images of GFP-LC3 puncta. Chl: chloroquine. Bar graph indicates mean number of LC3 puncta per area. n= 3 (TS with Chl), 3 (TS without Chl), 3 (TB1 with Chl), and 3 (TB1 without Chl). * p<0.05 vs. TS, # p<0.05 Chl (+) vs. Chl (−) in each group. *1 p=0.009, *2 p=0.031, *3 p=0.002,#1 p=0.025. C. Cultured CMs were transduced with Ad-Keima-MLS and then treated with TB1 or TS. Representative images of Keima-MLS. Puncta with high 560/440 indicate mitochondrial autophagy. The ratio of the area of puncta with high 560/440 vs. the total cell area obtained from 3 experiments is shown. Scale bar, 50 μm. * p=0.037 vs. TS. In D–N, mice were subjected to either sham operation or TAC for 30 days. These mice were then treated daily with either TB1 (n=12) or TS (n=13) on Days 7–21 and euthanized on Day 30. D. Gross morphology and HE staining of longitudinal sections of the mouse hearts. Scale bars, 5.0 mm. E. Representative M-mode tracings of echocardiographs and LVEF. * p<0.05 vs. TS with sham operation, # p<0.05 vs. TS with 30 days TAC. Scale bars, horizontal 250 ms and vertical 2.5 mm. *1 p=0.003,#1 p<0.001. F. Lung weight to TL (lung/tibia) ratio. # p<0.05 vs. TS. *1 p=0.007,#1 p=0.001. G. Representative LV pressure wave forms. Scale bars, vertical 40 mmHg and horizontal 60 ms. H. LVEDP, evaluated by hemodynamic measurements. # p<0.05 vs. TS with 30 days TAC. * p=0.035, #p=0.034. I. Pressure gradient at TAC. *p=0.010 vs. TS. J. PASR staining to assess cardiac fibrosis. * p<0.05 vs. TS with sham operation, # p<0.05 vs. TS with 30 days TAC. Scale bar, 500 μm. *1 p=0.001,#1 p=0.005. K. WGA staining to assess CM cross-sectional area. * p<0.05 vs. TS with sham operation, # p<0.05 vs. TS with 30 days TAC. Scale bar, 200 μm. *1 p=0.009,#1 p=0.011. L. TUNEL staining to assess CM apoptosis. * p<0.05 vs. TS with sham operation, # p<0.05 vs. TS with 30 days TAC. Scale bar, 50 μm. *1 p=0.003,#1 p=0.028. In M–N, whole-cell heart homogenates were subjected to immunoblots. M. Representative immunoblots and quantitative analysis of LC3 and GAPDH. * p<0.05 vs. TS with sham operation. # p<0.05 vs. TS with 30 days TAC. *1 p=0.001, *2 p=0.030, *3 p=0.016,#1 p=0.002. N. Representative immunoblots and quantitative analysis of p62 and GAPDH. * p<0.05 vs. TS with sham operation. *1 p=0.012, *2 p=0.036. In O–S, mice were subjected to either sham operation (TS: n=3, TB: n=3) or TAC (TS: n=3, TB: n=3). O. Relative mitochondrial DNA content. * p=0.032 vs. TS. P. Representative immunoblots and quantitative analysis of whole-cell heart homogenates for Cox I and GAPDH. * p<0.05 vs. TS with sham operation, # p<0.05 vs. TS with 30 days TAC. * p=0.042, #p=0.013. Q. Representative EM images of the mouse heart. The inset shows autophagosomes containing mitochondria, observed only in TB1-treated mice. Scale bar, 2 μm. R. Bar graphs indicate the number of autophagosomes containing mitochondria per total number of mitochondria. * p=0.039 vs. sham operation. S. Relative mitochondrial ATP production. * p=0.034 vs. TS.
Figure 8
Figure 8
The protective effect of TB1 in the PO heart was abrogated in Drp1-hetCKO and beclin 1-hetKO mice. In A–H, Drp1-hetCKO and control mice were subjected to either sham operation or TAC for 7 days. These mice were then treated daily with either TB1 (n=3) or TS (n=4) on Days 1–7 and euthanized on Day 7. A. Gross morphology of mouse hearts. Scale bars, 5.0 mm. B. LVEF, evaluated by echocardiography. *1 p=0.037, *2 p=0.029. C. Lung weight to TL (lung/tibia) ratio. *1 p=0.040. D. LVEDP, evaluated by hemodynamic measurement. E. Pressure gradient at TAC. F. Relative mitochondrial ATP production. G. Relative mitochondrial DNA content. H. Representative immunoblots and quantitative analysis of whole-cell heart homogenates for Cox I and GAPDH. In I–M, beclin 1-hetKO and control mice were subjected to either sham operation or TAC for 7 days. These mice were then treated daily with either TB1 (n=6) or TS (n=7) on Days 1–7 and euthanized on Day 7. I. Gross morphology of the mouse hearts. Scale bars, 5.0 mm. J. LVEF, evaluated by echocardiography. *1 p=0.040, *2 p=0.044. K. Lung weight to TL (lung/tibia) ratio. *1 p=0.040. L. LVEDP, evaluated by hemodynamic measurement. *1 p=0.011, *2 p=0.021. M. Pressure gradient at TAC.

Comment in

References

    1. Gatica D, Chiong M, Lavandero S, Klionsky DJ. Molecular mechanisms of autophagy in the cardiovascular system. Circ Res. 2015;116:456–467. - PMC - PubMed
    1. Maejima Y, Kyoi S, Zhai P, Liu T, Li H, Ivessa A, Sciarretta S, Del Re DP, Zablocki DK, Hsu CP, Lim DS, Isobe M, Sadoshima J. Mst1 inhibits autophagy by promoting Beclin1-Bcl-2 interaction. Nat Med. 2013;19:1478–1488. - PMC - PubMed
    1. Nakai A, Yamaguchi O, Takeda T, Higuchi Y, Hikoso S, Taniike M, Omiya S, Mizote I, Matsumura Y, Asahi M, Nishida K, Hori M, Mizushima N, Otsu K. The role of autophagy in cardiomyocytes in the basal state and in response to hemodynamic stress. Nat Med. 2007;13:619–624. - PubMed
    1. Saito T, Sadoshima J. The molecular mechanisms of mitochondrial autophagy/mitophagy in the heart. Circ Res. 2015;116:1477–1490. - PMC - PubMed
    1. Youle RJ, Narendra DP. Mechanisms of mitophagy. Nat Rev Mol Cell Biol. 2011;12:9–14. - PMC - PubMed

Publication types