. 2016 Apr;26(4):417-26.
doi: 10.1101/gr.203216.115. Epub 2016 Feb 25.

Transmission of human mtDNA heteroplasmy in the Genome of the Netherlands families: support for a variable-size bottleneck

Collaborators, Affiliations

Transmission of human mtDNA heteroplasmy in the Genome of the Netherlands families: support for a variable-size bottleneck

Mingkun Li et al. Genome Res. 2016 Apr.

Abstract

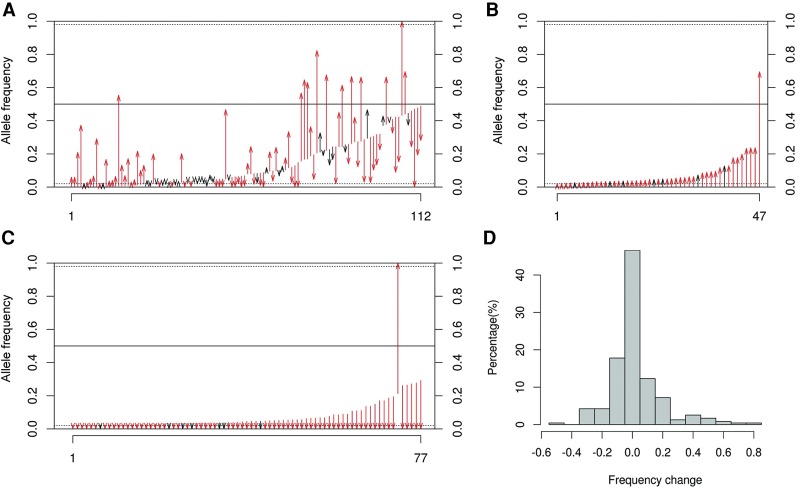
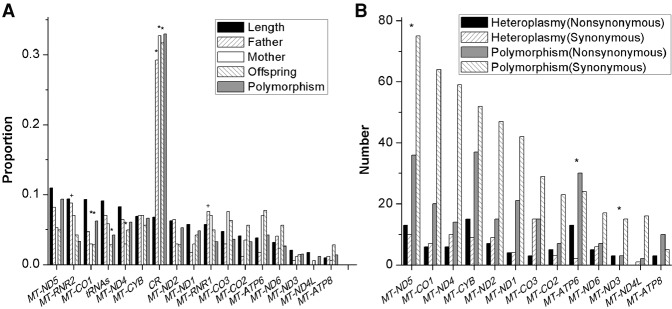
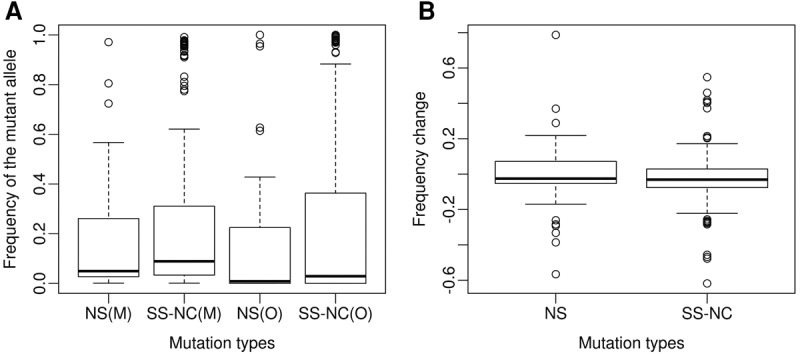
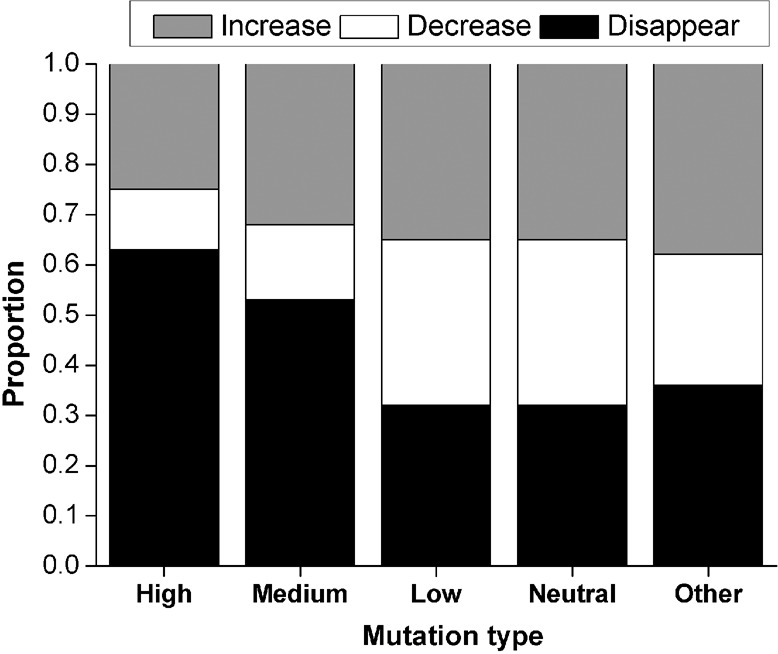
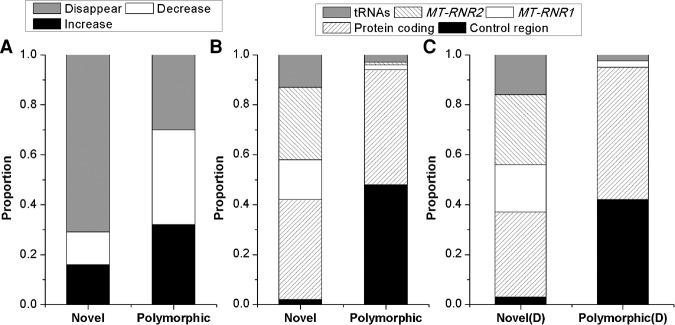
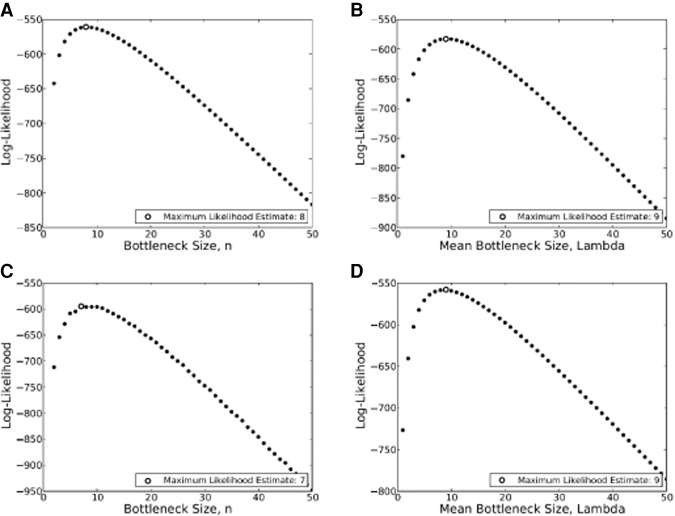
Although previous studies have documented a bottleneck in the transmission of mtDNA genomes from mothers to offspring, several aspects remain unclear, including the size and nature of the bottleneck. Here, we analyze the dynamics of mtDNA heteroplasmy transmission in the Genomes of the Netherlands (GoNL) data, which consists of complete mtDNA genome sequences from 228 trios, eight dizygotic (DZ) twin quartets, and 10 monozygotic (MZ) twin quartets. Using a minor allele frequency (MAF) threshold of 2%, we identified 189 heteroplasmies in the trio mothers, of which 59% were transmitted to offspring, and 159 heteroplasmies in the trio offspring, of which 70% were inherited from the mothers. MZ twin pairs exhibited greater similarity in MAF at heteroplasmic sites than DZ twin pairs, suggesting that the heteroplasmy MAF in the oocyte is the major determinant of the heteroplasmy MAF in the offspring. We used a likelihood method to estimate the effective number of mtDNA genomes transmitted to offspring under different bottleneck models; a variable bottleneck size model provided the best fit to the data, with an estimated mean of nine individual mtDNA genomes transmitted. We also found evidence for negative selection during transmission against novel heteroplasmies (in which the minor allele has never been observed in polymorphism data). These novel heteroplasmies are enhanced for tRNA and rRNA genes, and mutations associated with mtDNA diseases frequently occur in these genes. Our results thus suggest that the female germ line is able to recognize and select against deleterious heteroplasmies.


Figures

Figure 1.
Figure 1.
Minor allele frequency (MAF) changes between mothers and offspring. Red arrows indicate cases in which the MAF changed significantly between mother and offspring (P < 0.00001, Fisher's exact test). (A) MAF change for heteroplasmies detectable in both mothers and offspring. (B) MAF change for heteroplasmies detected in offspring but not in mothers. (C) MAF change for heteroplasmies detected in mothers but not in offspring. (D) Summary of the MAF changes observed for all heteroplasmies.
Figure 2.
Figure 2.
Distribution of heteroplasmies in different mtDNA gene regions. (A) Overall distribution of heteroplasmies. Black bars represent the expected heteroplasmy frequency for each gene region based purely on length. Uphill-striped, white, and downhill-striped bars represent the observed proportion of heteroplasmies identified in fathers, mothers, and offspring, respectively. Gray bars represent the polymorphism frequency for each gene region (inferred from PhyloTree Build 15 [van Oven and Kayser 2009]). Asterisks indicate significant differences (P < 0.01) between the observed and expected proportion of heteroplasmy based on gene region length, and the plus signs indicate significant differences between the observed and expected proportion of heteroplasmy based on polymorphism frequency. There were no significant differences observed between fathers and mothers, fathers and offspring, or mothers and offspring in the distribution of heteroplasmies across gene regions. (B) Number of nonsynonymous (NS) and synonymous (SS) heteroplasmies and polymorphisms observed in different genes. Asterisks indicate that the NS:SS ratio for heteroplasmies is significantly greater than the NS:SS ratio for polymorphisms in the respective gene (P < 0.05).
Figure 3.
Figure 3.
Frequency of the mutant allele (relative to the revised Cambridge Reference Sequence [rCRS]) and frequency change of the mutant allele for different mutation types. (A) Frequency of the mutant allele for: NS mutations in the mother [NS(M)]; SS and NC mutations in the mother [SS-NC(M)]; NS mutations in the offspring [NS(O)]; and SS and NC mutations in the offspring [SS-NC(O)]. (B) Distribution of the frequency change of NS and SS-NC mutations during transmission from mothers to offspring. The same results were obtained when the analyses were done for the minor allele at each position rather than the non-rCRS allele.
Figure 4.
Figure 4.
Frequency change during transmission for different types of NS mutations. NS mutations were categorized in terms of likely functional impact on the protein as high risk, medium risk, low risk, or neutral (Reva et al. 2011). Other: SS and NC mutations.
Figure 5.
Figure 5.
Transmission characteristics of heteroplasmies for novel versus polymorphic heteroplasmies. (A) Proportion of minor alleles observed in mothers that disappear entirely, decrease in frequency, or increase in frequency in the offspring for novel versus polymorphic heteroplasmies. (B) Distribution across genic regions of all heteroplasmies involving novel versus polymorphic heteroplasmies. (C) Distribution across genic regions for novel heteroplasmies that disappeared in the offspring [Novel(D)] compared to polymorphic heteroplasmies that disappeared in the offspring [Polymorphic(D)]. The MT-RNR1 and MT-RNR2 genes and the tRNA genes are overrepresented in the novel heteroplasmies.
Figure 6.
Figure 6.
Likelihood curves for the observed data (changes in MAF from mothers to offspring) under different models for the transmission of mtDNA. (A) Likelihood curve for the constant-size bottleneck model with mtDNA genomes as segregating units. (B) Likelihood curve for the variable-size bottleneck model with mtDNA genomes as segregating units. (C) Likelihood curve for the constant-size nucleoid model. (D) Likelihood curve for the variable-size nucleoid model.

References

    1. Andrew T, Calloway CD, Stuart S, Lee SH, Gill R, Clement G, Chowienczyk P, Spector TD, Valdes AM. 2011. A twin study of mitochondrial DNA polymorphisms shows that heteroplasmy at multiple sites is associated with mtDNA variant 16093 but not with zygosity. PLoS One 6: e22332. - PMC - PubMed
    1. Bandelt HJ, Salas A. 2012. Current next generation sequencing technology may not meet forensic standards. Forensic Sci Int Genet 6: 143–145. - PubMed
    1. Bendall KE, Macaulay VA, Baker JR, Sykes BC. 1996. Heteroplasmic point mutations in the human mtDNA control region. Am J Hum Genet 59: 1276–1287. - PMC - PubMed
    1. Bogenhagen DF. 2012. Mitochondrial DNA nucleoid structure. Biochim Biophys Acta 1819: 914–920. - PubMed
    1. Boomsma DI, Wijmenga C, Slagboom EP, Swertz MA, Karssen LC, Abdellaoui A, Ye K, Guryev V, Vermaat M, van Dijk F, et al. 2014. The Genome of the Netherlands: design, and project goals. Eur J Hum Genet 22: 221–227. - PMC - PubMed

Publication types

Substances

LinkOut - more resources