. 2016 Feb 26:6:22171.
doi: 10.1038/srep22171.

Autophagy is activated to protect against endotoxic acute kidney injury

Affiliations

Autophagy is activated to protect against endotoxic acute kidney injury

Shuqin Mei et al. Sci Rep. .

Abstract

Endotoxemia in sepsis, characterized by systemic inflammation, is a major cause of acute kidney injury (AKI) in hospitalized patients, especially in intensive care unit; however the underlying pathogenesis is poorly understood. Autophagy is a conserved, cellular catabolic pathway that plays crucial roles in cellular homeostasis including the maintenance of cellular function and viability. The regulation and role of autophagy in septic or endotoxic AKI remains unclear. Here we show that autophagy was induced in kidney tubular cells in mice by the endotoxin lipopolysaccharide (LPS). Pharmacological inhibition of autophagy with chloroquine enhanced LPS-induced AKI. Moreover, specific ablation of autophagy gene 7 (Atg7) from kidney proximal tubules worsened LPS-induced AKI. Together, the results demonstrate convincing evidence of autophagy activation in endotoxic kidney injury and support a renoprotective role of autophagy in kidney tubules.


Figures

Figure 1
Figure 1. LPS-induced AKI in mice.
C57BL/6 mice (male, 8–12 weeks old) were divided into 4 groups and subjected to the following treatment: 1) control (injected with saline); 2) LPS treatment for 4 hours; 3) LPS treatment for 24 hours; 4) LPS treatment for 48 hours. (a,b) Blood samples were collected for BUN and creatinine measurement. *P < 0.05 significant difference vs. control. (c) H&E staining of renal histology of AKI following LPS (10 mg/kg, 24 hours), cisplatin (25 mg/kg, 4 days), and 28 minutes of bilateral renal ischemia followed by 48 hours reperfusion (×200). (d) Representative images of TUNEL staining of kidney tissues from control and LPS (24 hours)-treated mice. (e) TUNEL positive cells were counted and expressed as mean ± SD per square mm area. *P < 0.05 significant difference vs. control.
Figure 2
Figure 2. LC3II accumulation in kidney tissues during LPS treatment.
(a) Representative immunoblots. (b) The LC3II and GAPDH signals in immunblots were analyzed by densitometry to calculate the ratio to expressed as mean ± SD. *P < 0.05, significantly different from other groups.
Figure 3
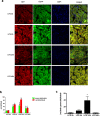
Figure 3. Dynamics of autophagy during LPS-induced AKI shown by CAG-RFP-EGFP-LC3 mice.
(a) Representative images to show the dynamic changes of RFP and EGFP-LC3 puncta in kidney tubules during LPS treatment. (b) Quantification of EGFP and RFP puncta per tubule. Data were expressed as mean ± SD. *P < 0.05, significant difference in RFP-LC3 puncta vs. control group; #P < 0.05, significant difference in EGFP-LC3 puncta vs. control. (c) The number of RFP-red puncta was subtracted by the number of EGFP-green puncta to estimate the number of lysosomes. Data were expressed as mean ± SD. *P < 0.05, significant difference vs. other groups.
Figure 4
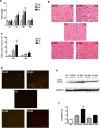
Figure 4. Chloroquine enhances LPS-induced AKI in C57BL/6 mice.
C57BL/6 mice (male, 8–12 weeks old) were divided into 5 groups to subject to following treatments: 1) NC (normal control: injected with saline); 2) SL24 h (saline + LPS treatment for 24 hours); 3) CL24 h (chloroquine + LPS treatment for 24 hours); 4) SL48 h (saline + LPS treatment for 48 hours); 3) CL48 h (chloroquine + LPS treatment for 48 hours). (a) Blood samples were collected for BUN analysis. *P < 0.05, significant difference vs. NC group; #P < 0.05, significant difference vs. SL. (b) Representative histology by H&E staining (×200). (c) Quantification of TUNEL positive cells in kidney tissues. Data were expressed as mean ± SD. *P < 0.05, significant difference vs. NC group; #P < 0.05, significant difference vs. SL group. (d) Representative images of TUNEL staining. (e) Representative immunoblots of LC3 and GAPDH in kidney tissues. (f) The LC3II and GAPDH signals in immunoblots were analyzed by densitometry to calculate the ratio. Data were expressed as mean ± SD. *P < 0.05, significant difference vs. NC group; #P < 0.05, significant difference vs. SL group.
Figure 5
Figure 5. Suppression of autophagy and decrease of renal function in PT-Atg7-KO mice after LPS treatment.
PT-Atg7-KO mice and wild-type PT- Atg7-WT littermates were treated with 10 mg/kg LPS. (a) Whole tissue lysate of the kidney was collected for immunoblot analysis of Atg7, p62, LC3, and GAPDH. (b) The LC3II and GAPDH signals in immunoblots were analyzed by densitometry to calculate the ratio to express as mean ± SD. *P < 0.05, significant difference between PT-Atg7-WT and PT-Atg7-KO group. (c,d) Blood samples were collected for BUN and creatinine measurement. *P < 0.05, significant difference between PT-Atg7-WT and PT-Atg7-KO group.
Figure 6
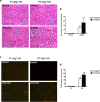
Figure 6. LPS-induced AKI is more severe in PT-Atg7-KO mice PT-Atg7- KO mice and wild-type PT-Atg7-WT littermates were injected to 10 mg/kg LPS.
(a) Representative histology shown by H&E staining (×200). (b) Percentage of injured tubules evaluated by counting the renal tubules with signs of injury. Data were expressed as mean ± SD. *P < 0.05, significant difference vs. their corresponding control; #P < 0.05, significant difference between PT-Atg7-WT and PT-Atg7-KO group. (c) Representative images of TUNEL staining. (d) Quantification of TUNEL positive cells in kidney tissues. Data were expressed as mean ± SD. *P < 0.05, significant difference between PT-Atg7-WT and PT-Atg7-KO group.

References

    1. Bone R. C. et al. Definitions for sepsis and organ failure and guidelines for the use of innovative therapies in sepsis. The ACCP/SCCM Consensus Conference Committee. American College of Chest Physicians/Society of Critical Care Medicine. Chest 101, 1644–1655 (1992). - PubMed
    1. Emlet D. R., Shaw A. D. & Kellum J. A. Sepsis-associated AKI: epithelial cell dysfunction. Semin Nephrol 35, 85–95, 10.1016/j.semnephrol.2015.01.009 (2015). - DOI - PubMed
    1. Martensson J. & Bellomo R. Sepsis-Induced Acute Kidney Injury. Cri Care Clin 31, 649–660, 10.1016/j.ccc.2015.06.003 (2015). - DOI - PubMed
    1. Havasi A. & Borkan S. C. Apoptosis and acute kidney injury. Kidney Int 80, 29–40, 10.1038/ki.2011.120 (2011). - DOI - PMC - PubMed
    1. Zarjou A. & Agarwal A. Sepsis and acute kidney injury. J Am Soc Nephrol 22, 999–1006, 10.1681/asn.2010050484 (2011). - DOI - PubMed

Publication types

LinkOut - more resources