. 2016 Sep;18(9):1219-29.
doi: 10.1093/neuonc/now024. Epub 2016 Feb 24.

Glycolysis and the pentose phosphate pathway are differentially associated with the dichotomous regulation of glioblastoma cell migration versus proliferation

Affiliations

Glycolysis and the pentose phosphate pathway are differentially associated with the dichotomous regulation of glioblastoma cell migration versus proliferation

Annegret Kathagen-Buhmann et al. Neuro Oncol. 2016 Sep.

Abstract

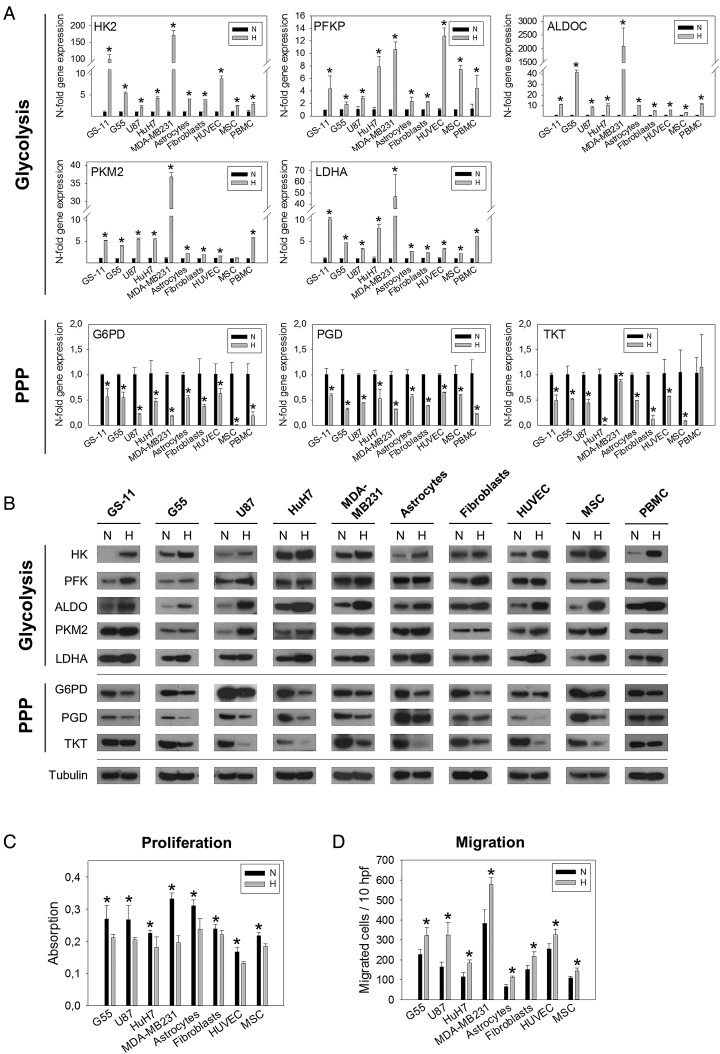
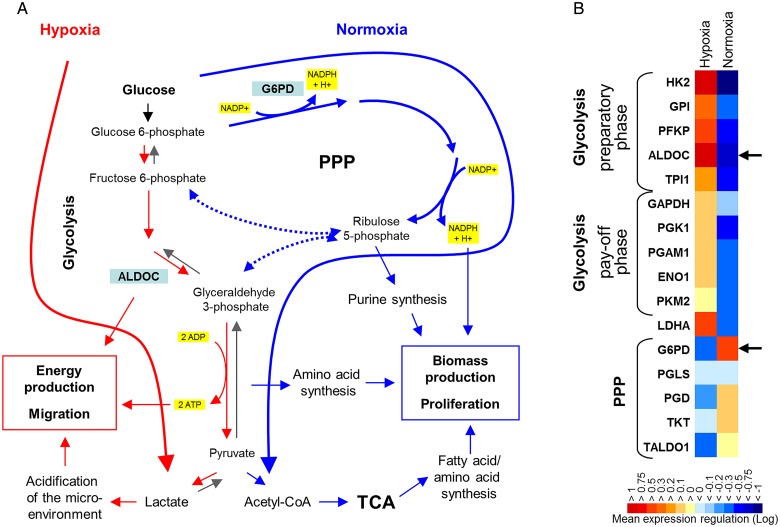
Background: The dichotomy between glioblastoma cell migration and proliferation is regulated by various parameters including oxygen tension. In glioblastoma stem-like cells, hypoxia induces downregulation of pentose phosphate pathway (PPP) enzymes and a flux shift towards glycolysis. We investigated whether the 2 parallel glucose metabolic pathways are intrinsically linked with cell function and whether these pathways are mechanistically involved in regulating functional programs.

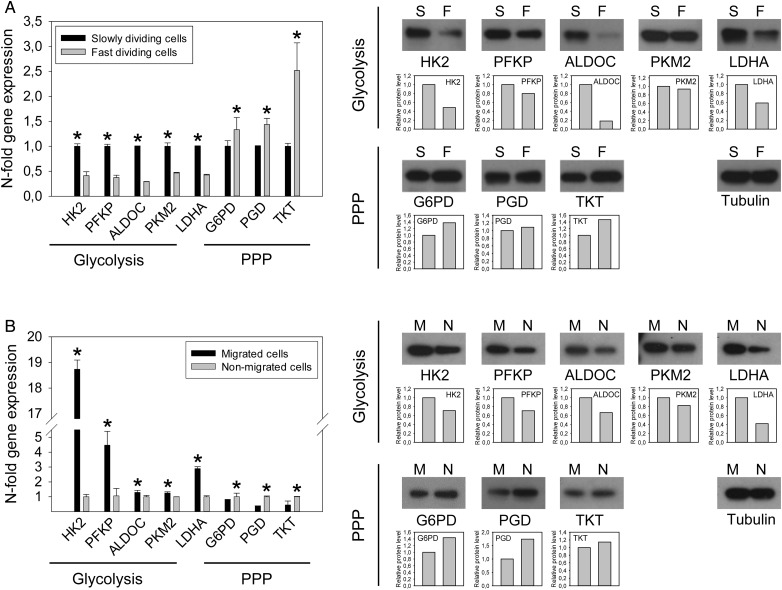
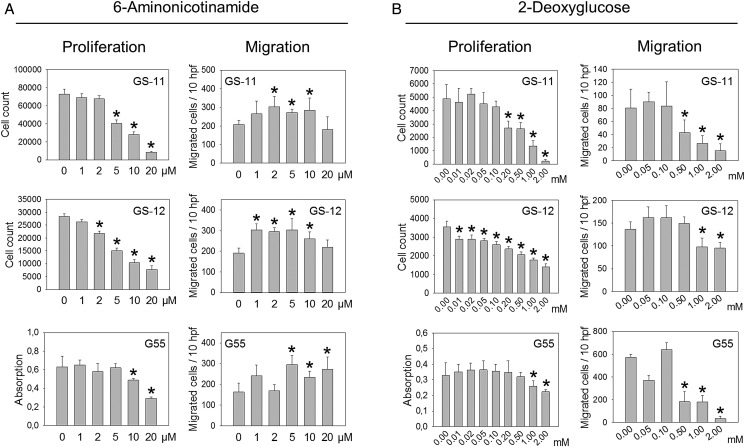
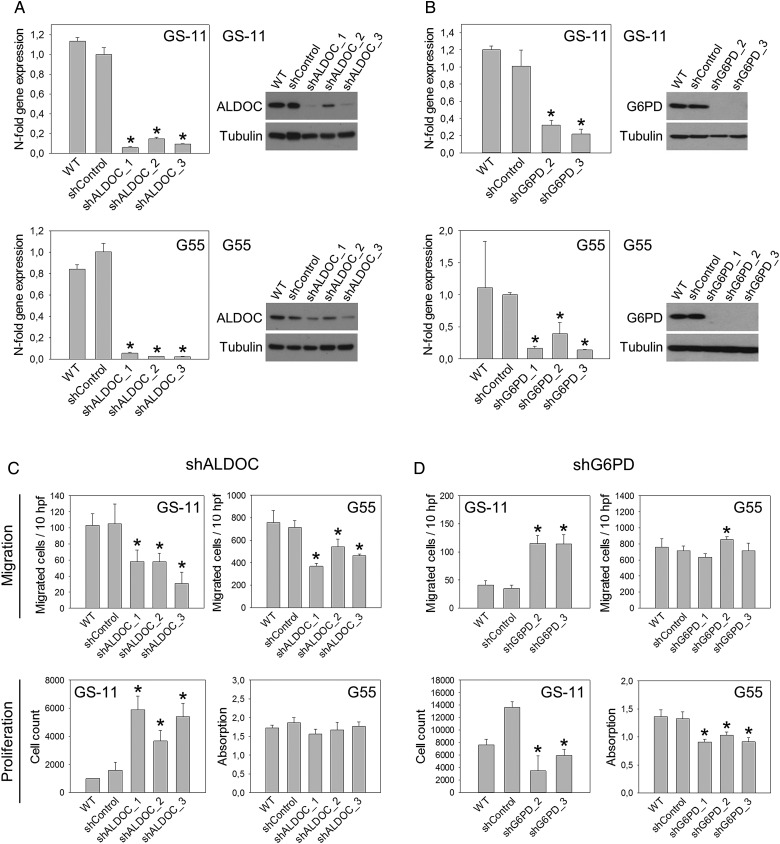
Methods: Enzyme expression, migration, and proliferation under hypoxia were studied in multiple cell types. Rapidly and slowly dividing or migrating glioblastoma cells were separated, and enzyme profiles were compared. Glucose-6-phosphate dehydrogenase (G6PD) and Aldolase C (ALDOC), the most strongly inversely regulated PPP and glycolysis enzymes, were knocked down by short hairpin RNA.

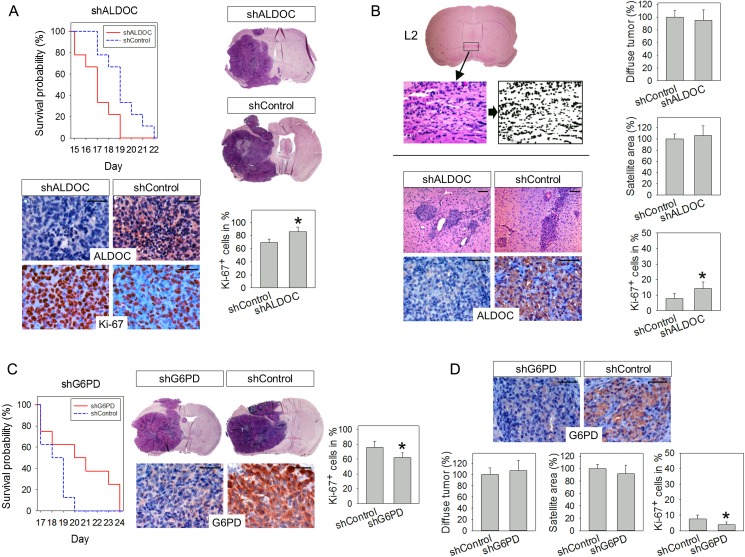
Results: Hypoxia caused downregulation of PPP enzymes and upregulation of glycolysis enzymes in a broad spectrum of cancer and nonneoplastic cells and consistently stimulated migration while reducing proliferation. PPP enzyme expression was increased in rapidly dividing glioblastoma cells, whereas glycolysis enzymes were decreased. Conversely, glycolysis enzymes were elevated in migrating cells, whereas PPP enzymes were diminished. Knockdown of G6PD reduced glioblastoma cell proliferation, whereas ALDOC knockdown decreased migration. Enzyme inhibitors had similar effects. G6PD knockdown in a highly proliferative but noninvasive glioblastoma cell line resulted in prolonged survival of mice with intracerebral xenografts, whereas ALDOC knockdown shortened survival. In a highly invasive glioblastoma xenograft model, tumor burden was unchanged by either knockdown.

Conclusions: Cell function and metabolic state are coupled independently of hypoxia, and glucose metabolic pathways are causatively involved in regulating "go or grow" cellular programs.

Keywords: glioma; glycolysis; invasion; metabolism; pentose phosphate pathway.


Figures

Fig. 1.
Fig. 1.
Effect of hypoxia on enzyme expression and cell function. (A) Quantification of glycolysis and pentose phosphate pathway (PPP) enzyme transcripts by qPCR in different cell types exposed to hypoxia (H), (1% O2). Relative quantities were calculated and normalized to normoxic (N) controls. Asterisks indicate significant maximal upregulation or downregulation of transcripts, which typically occurred at 48 hours (P < .05). (B) Immunoblot analysis of glycolysis and PPP enzymes after 48 hours of hypoxia versus normoxia. Densitometric analysis is presented in Supplementary material, Fig. S1. (C) Cell proliferation was quantified after 3 days of growth using a colorimetric assay. Values are means ± SD of quadruplicate determinations. (D) Cell migration was analyzed in modified Boyden chamber assays. After 5 hours of incubation, migrated cells were counted in 10 high power fields (hpf). Values are means ± SD of sextuplicate determinations. Asterisks in (C) and (D) indicate significance (P < .05).
Fig. 2.
Fig. 2.
Expression of glycolysis and pentose phosphate pathway (PPP) enzymes in G55 cell subpopulations. (A) Fast and slowly dividing cell subpopulations were isolated by fluorescence-activated cell sorting (FACS) from PKH67-labelled cells (slowly: 8.9%, fast: 9.4% of all cells). qPCR and immunoblot analysis revealed downregulation of glycolysis enzymes in fast dividing (F) versus slowly dividing (S) cells, paralleled by upregulation of PPP enzymes. (B) Migrated (M) and nonmigrated (N) cells were separated using transwell assays. Migrated cells displayed increased expression of glycolysis enzymes and downregulation of PPP enzymes. Asterisks mark significant differences (P < .05).
Fig. 3.
Fig. 3.
Enzyme regulation by hypoxia and normoxia. (A) Under normoxic conditions, pentose phosphate pathway (PPP) enzyme expression and flux are upregulated to facilitate biomass production and cell cycling (blue arrows). Acute hypoxia causes downregulation of PPP enzymes and shifts glucose metabolism towards direct glycolysis (red arrow), facilitating rapid energy production and cell migration. (B) Gene expression profiling showed that enzymes of the preparatory phase of glycolysis (HK2, GPI, PFKP, ALDOC) are more strongly upregulated by hypoxia than enzymes of the pay-off phase (original microarray data are published in Kathagen et al.). G6PD and ALDOC emerged as the most strongly inversely hypoxia-regulated enzymes of both pathways. Colors represent mean n-fold enzyme transcript regulation in 4 GS cell lines exposed to acute hypoxia (48 h) versus normoxia. Abbreviations: HK2, hexokinase 2; GPI, glucose-6-phosphate isomerase; PFKP, 6-phosphofructokinase platelet type; ALDOC, aldolase C; TPI1, triosephosphate isomerase 1; GAPDH, glyceraldehyde-3-phosphate dehydrogenase; PGK1, phosphoglycerate kinase 1; PGAM1, phosphoglycerate mutase 1; ENO1, enolase 1; PKM2, pyruvate kinase M2; LDHA, lactate dehydrogenase A chain; G6PD, glucose-6-phosphate dehydrogenase; PGLS, 6-phosphogluconolactonase; PGD, 6-phosphogluconate dehydrogenase; TKT, transketolase; TALDO1, transaldolase 1.
Fig. 4.
Fig. 4.
Functional effects of 6-AN and 2-DG. Proliferation and migration were analyzed in the presence or absence of 6-AN (A) or 2-DG (B). GS cell proliferation was analyzed by cell counting after 7 days of incubation, and G55 proliferation was determined after 4 days using a colorimetric assay. Migration was analyzed in modified Boyden chamber assays with 24 hours (GS cells) or 5 hours (G55) of incubation. All experiments were performed at 21% O2. Values are means ± SD of sextuplicate determinations. Asterisks indicate significant inhibition or stimulation (P < .05).
Fig. 5.
Fig. 5.
Aldolase C (ALDOC) and glucose-6-phosphate dehydrogenase (G6PD) knockdown in vitro. (A) Quantification of ALDOC expression by qPCR and immunoblot analysis in GS-11 and G55 cells transduced with 3 different ALDOC shRNAs or nonsilencing shRNA (shControl) and in untransduced wild-type (WT) cells. Gene expression values are means ± SD of triplicate determinations, asterisks indicate significant downregulation compared with shControls (P < .05). (B) Quantification of G6PD in cells transduced with shRNAs targeting G6PD or nonsilencing shRNA. α-tubulin served as loading control. Effects of ALDOC knockdown (C) and G6PD knockdown (D) on cell migration and proliferation were analyzed as described in Fig. 4. Values in (C)and (D) are means ± SD of sextuplicate determinations. Asterisks indicate significant differences versus shControls (P < .05).
Fig. 6.
Fig. 6.
In vivo effects of Aldolase C (ALDOC) and glucose-6-phosphate dehydrogenase (G6PD) knockdown. (A) Mice engrafted with G55-shALDOC_1 cells had a shorter survival than mice with shControl tumors (P = .015). Tumor morphologies in both groups were similar (H&E staining). Immunohistochemically, reduced expression of ALDOC was detected in shALDOC_1 tumors compared with shControls. Tumor cell proliferation (Ki-67) was increased in shALDOC_1 tumors. (B) Diffuse tumor burden in mice engrafted with GS-11-shALDOC_1 cells was assessed by analyzing 20 landmark areas (at 4 coronal levels [L1-L4] in 5 defined regions each). Exemplary analysis of diffuse invasion is shown for L2 (anterior commissure level). Digital images of all 20 regions were acquired from H&E-stained sections, transformed into black and white, and the percentage of black pixels was quantified. Values acquired for identical regions in normal murine brain were subtracted, resulting in the net area occupied by tumor cell nuclei. Values for all regions were pooled and expressed as diffuse tumor burden (means ± SD in %). Micronodular tumor burden was assessed by measuring the cumulative micronodular tumor area at 4 coronal levels. Immunohistochemically, reduced ALDOC expression was present in knockdown tumors, while tumor cell proliferation was increased in GS-11-shALDOC_1 tumors. (C) Survival of mice with G55-shG6PD_2 tumors was prolonged relative to controls (P = .046). G6PD expression and tumor cell proliferation were reduced in knockdown tumors. (D) G6PD expression was reduced in GS-11-shG6PD_2 tumors. Diffuse and micronodular tumor burden was analyzed as described for (B). G6PD expression and proliferation of knockdown tumors was decreased compared with controls. Asterisks in (A)-(D) indicate significance (P < .05); size bars are 50 µm.

References

    1. Giese A, Bjerkvig R, Berens ME, Westphal M. Cost of migration: invasion of malignant gliomas and implications for treatment. J Clin Oncol. 2003;21 (8):1624–1636. - PubMed
    1. Keunen O, Johansson M, Oudin A et al. . Anti-VEGF treatment reduces blood supply and increases tumor cell invasion in glioblastoma. Proc Natl Acad Sci USA. 2011;108 (9):3749–3754. - PMC - PubMed
    1. Kunkel P, Ulbricht U, Bohlen P et al. . Inhibition of glioma angiogenesis and growth in vivo by systemic treatment with a monoclonal antibody against vascular endothelial growth factor receptor-2. Cancer Res. 2001;61 (18):6624–6628. - PubMed
    1. Fack F, Espedal H, Keunen O et al. . Bevacizumab treatment induces metabolic adaptation toward anaerobic metabolism in glioblastomas. Acta Neuropathol. 2015;129 (1):115–131. - PMC - PubMed
    1. Griguer CE, Oliva CR, Gobin E et al. . CD133 is a marker of bioenergetic stress in human glioma. PLoS One. 2008;3 (11):e3655. - PMC - PubMed

Publication types