

Genomic landscape of the individual host response and outcomes in sepsis: a prospective cohort study
- PMID: 26917434
- PMCID: PMC4820667
- DOI: 10.1016/S2213-2600(16)00046-1
Genomic landscape of the individual host response and outcomes in sepsis: a prospective cohort study
Abstract
Background: Effective targeted therapy for sepsis requires an understanding of the heterogeneity in the individual host response to infection. We investigated this heterogeneity by defining interindividual variation in the transcriptome of patients with sepsis and related this to outcome and genetic diversity.
Methods: We assayed peripheral blood leucocyte global gene expression for a prospective discovery cohort of 265 adult patients admitted to UK intensive care units with sepsis due to community-acquired pneumonia and evidence of organ dysfunction. We then validated our findings in a replication cohort consisting of a further 106 patients. We mapped genomic determinants of variation in gene transcription between patients as expression quantitative trait loci (eQTL).
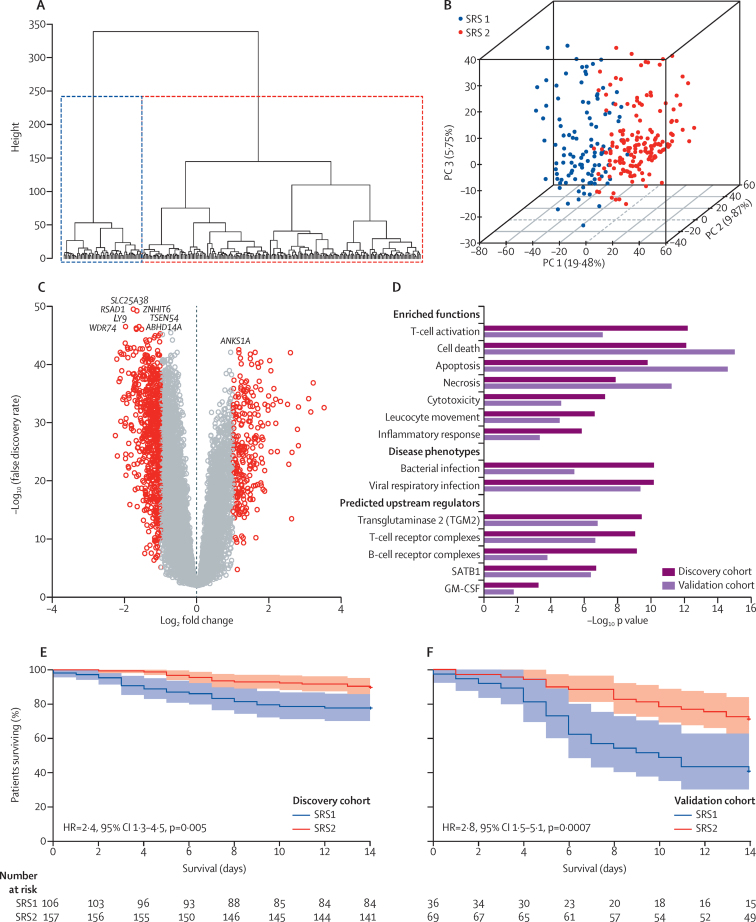
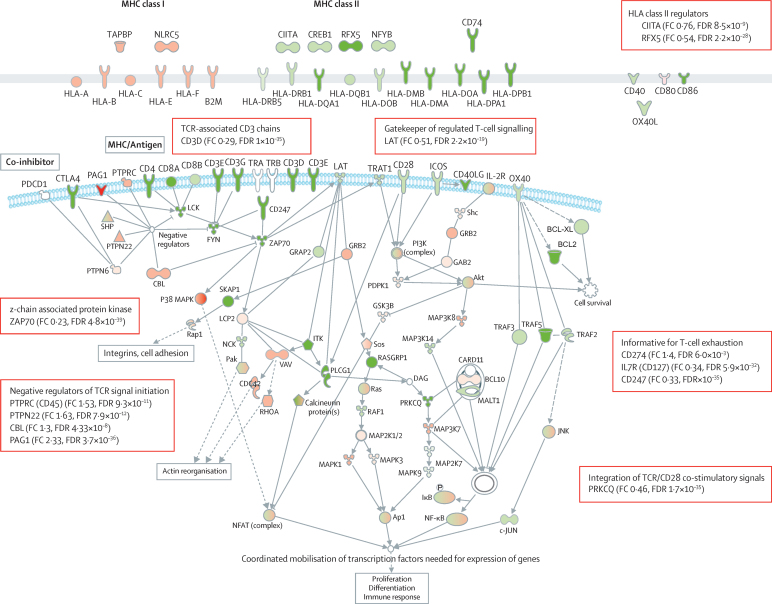
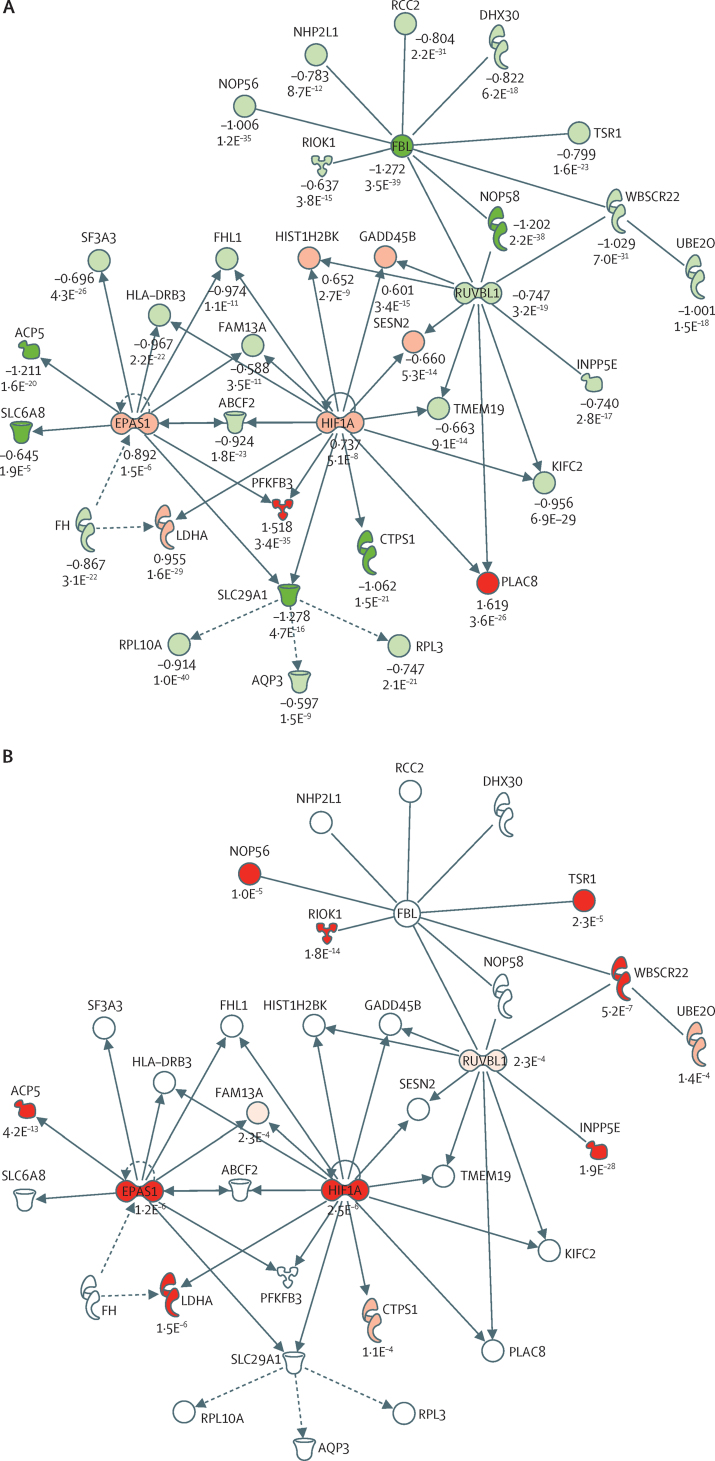
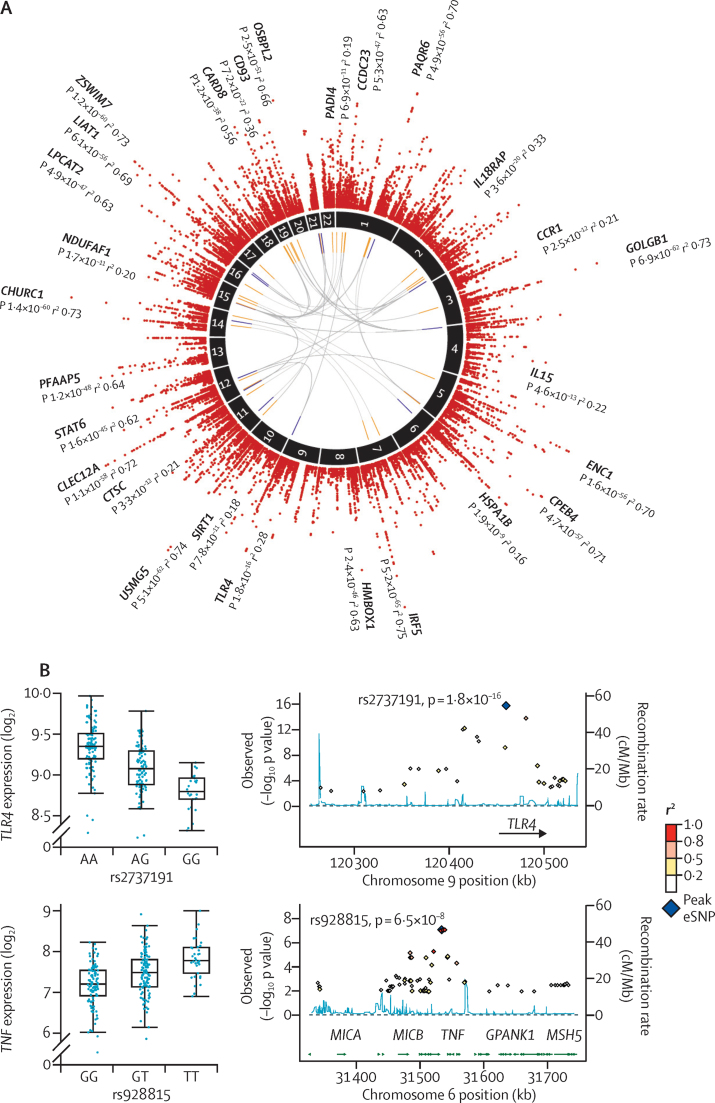
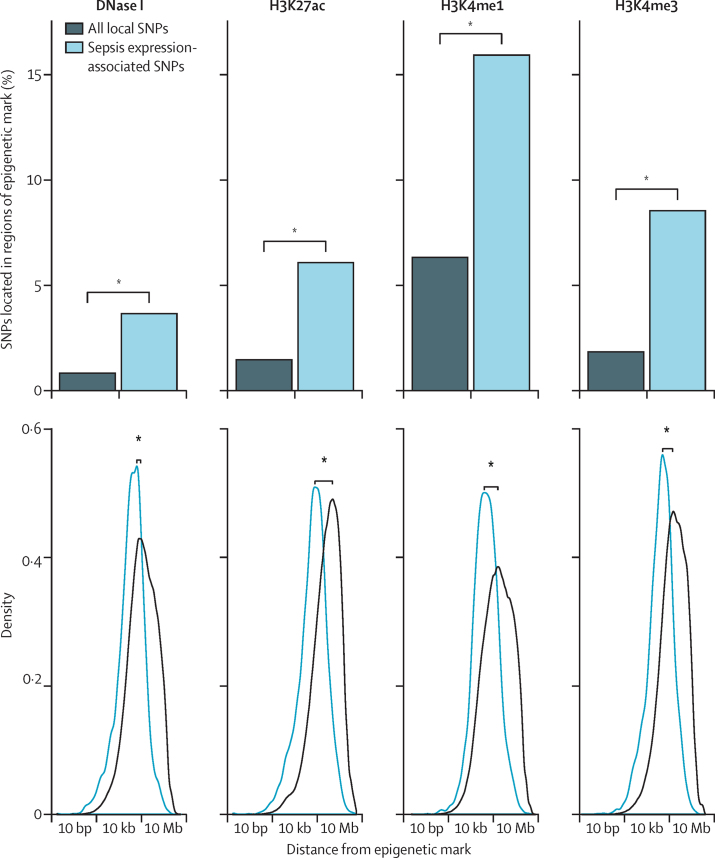
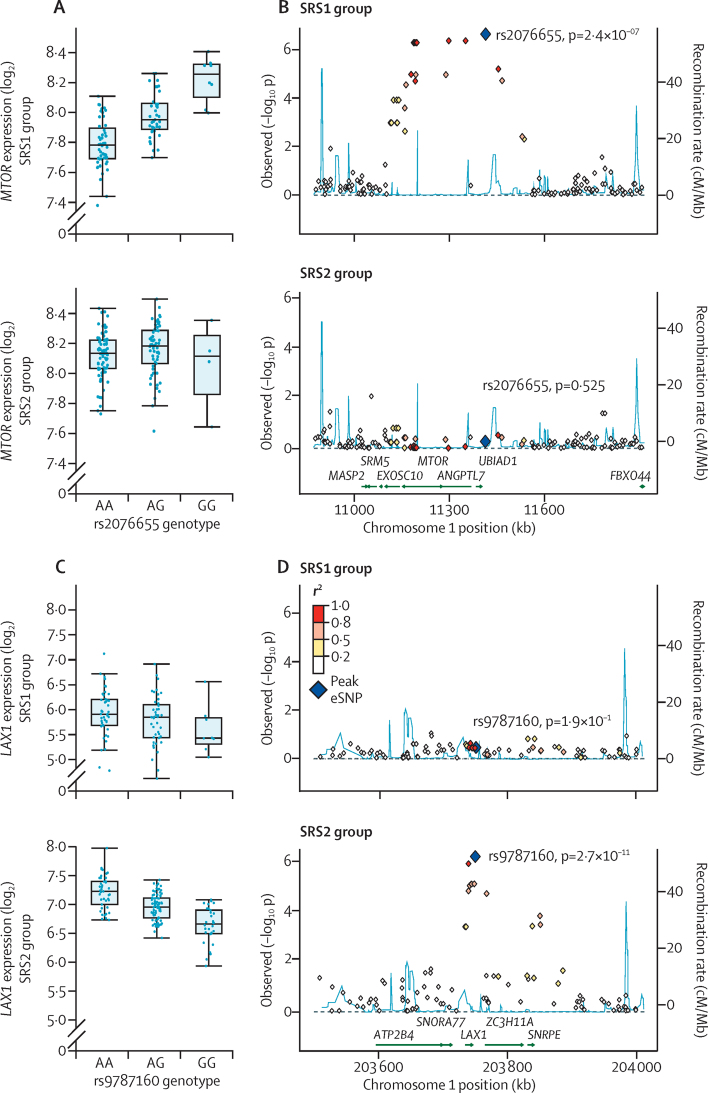
Findings: We discovered that following admission to intensive care, transcriptomic analysis of peripheral blood leucocytes defines two distinct sepsis response signatures (SRS1 and SRS2). The presence of SRS1 (detected in 108 [41%] patients in discovery cohort) identifies individuals with an immunosuppressed phenotype that included features of endotoxin tolerance, T-cell exhaustion, and downregulation of human leucocyte antigen (HLA) class II. SRS1 was associated with higher 14 day mortality than was SRS2 (discovery cohort hazard ratio (HR) 2·4, 95% CI 1·3-4·5, p=0·005; validation cohort HR 2·8, 95% CI 1·5-5·1, p=0·0007). We found that a predictive set of seven genes enabled the classification of patients as SRS1 or SRS2. We identified cis-acting and trans-acting eQTL for key immune and metabolic response genes and sepsis response networks. Sepsis eQTL were enriched in endotoxin-induced epigenetic marks and modulated the individual host response to sepsis, including effects specific to SRS group. We identified regulatory genetic variants involving key mediators of gene networks implicated in the hypoxic response and the switch to glycolysis that occurs in sepsis, including HIF1α and mTOR, and mediators of endotoxin tolerance, T-cell activation, and viral defence.
Interpretation: Our integrated genomics approach advances understanding of heterogeneity in sepsis by defining subgroups of patients with different immune response states and prognoses, as well as revealing the role of underlying genetic variation. Our findings provide new insights into the pathogenesis of sepsis and create opportunities for a precision medicine approach to enable targeted therapeutic intervention to improve sepsis outcomes.
Funding: European Commission, Medical Research Council (UK), and the Wellcome Trust.
Copyright © 2016 Davenport et al. Open Access article distributed under the terms of CC BY. Published by Elsevier Ltd.. All rights reserved.
Figures
Comment in
-
Individual gene expression and personalised medicine in sepsis.Lancet Respir Med. 2016 Apr;4(4):242-3. doi: 10.1016/S2213-2600(16)00068-0. Epub 2016 Feb 24. Lancet Respir Med. 2016. PMID: 26928384 No abstract available.
-
Sepsis Therapies: Insights from Population Health to Cellular Therapies and Genomic Medicine.Am J Respir Crit Care Med. 2018 Dec 15;198(12):1570-1572. doi: 10.1164/rccm.201804-0782RR. Am J Respir Crit Care Med. 2018. PMID: 30277812 Free PMC article. No abstract available.
References
-
- Marshall JC. Why have clinical trials in sepsis failed? Trends Mol Med. 2014;20:195–203. - PubMed
-
- Cohen J, Vincent JL, Adhikari NK. Sepsis: a roadmap for future research. Lancet Infect Dis. 2015;15:581–614. - PubMed
-
- Chapman SJ, Hill AV. Human genetic susceptibility to infectious disease. Nat Rev Genet. 2012;13:175–188. - PubMed
Publication types
MeSH terms
Grants and funding
LinkOut - more resources
Full Text Sources
Other Literature Sources
Medical
Research Materials
Miscellaneous
