. 2015 Jul 29;1(1):62-71.
doi: 10.1016/j.cels.2015.06.001.

Programming a Human Commensal Bacterium, Bacteroides thetaiotaomicron, to Sense and Respond to Stimuli in the Murine Gut Microbiota

Affiliations

Programming a Human Commensal Bacterium, Bacteroides thetaiotaomicron, to Sense and Respond to Stimuli in the Murine Gut Microbiota

Mark Mimee et al. Cell Syst. .

Abstract

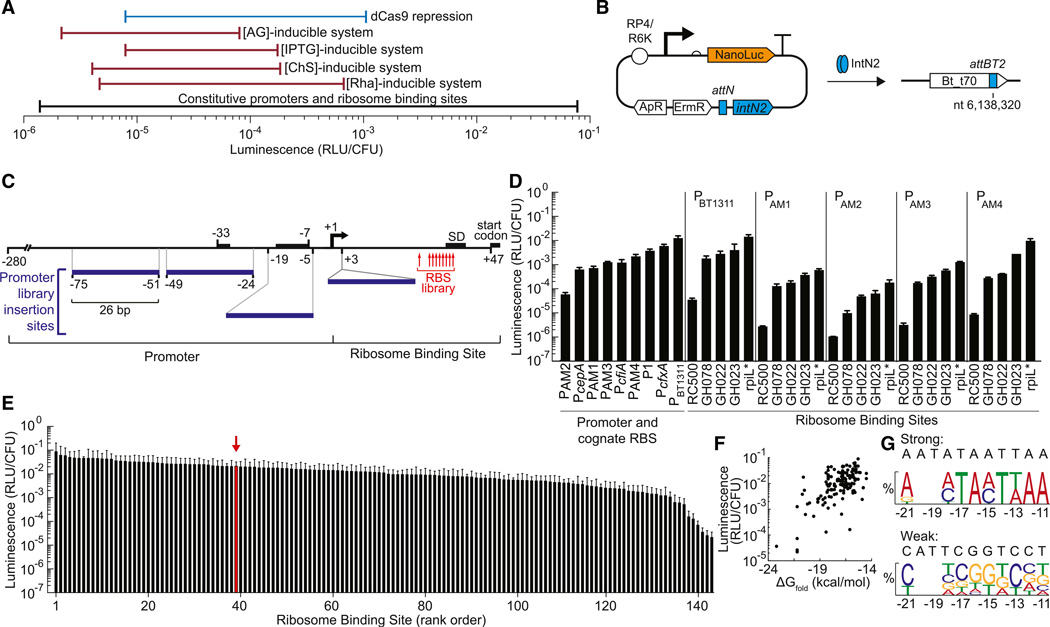
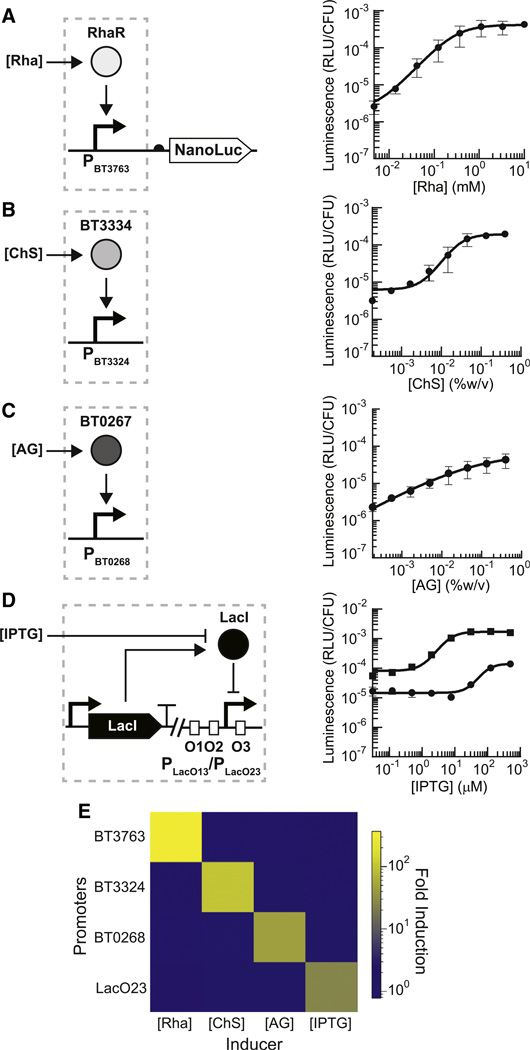
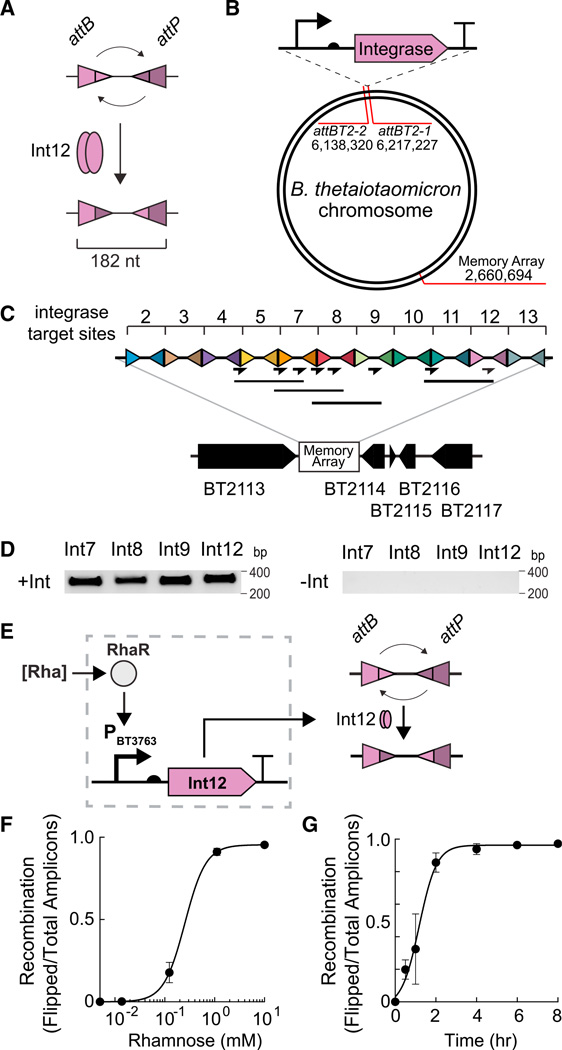
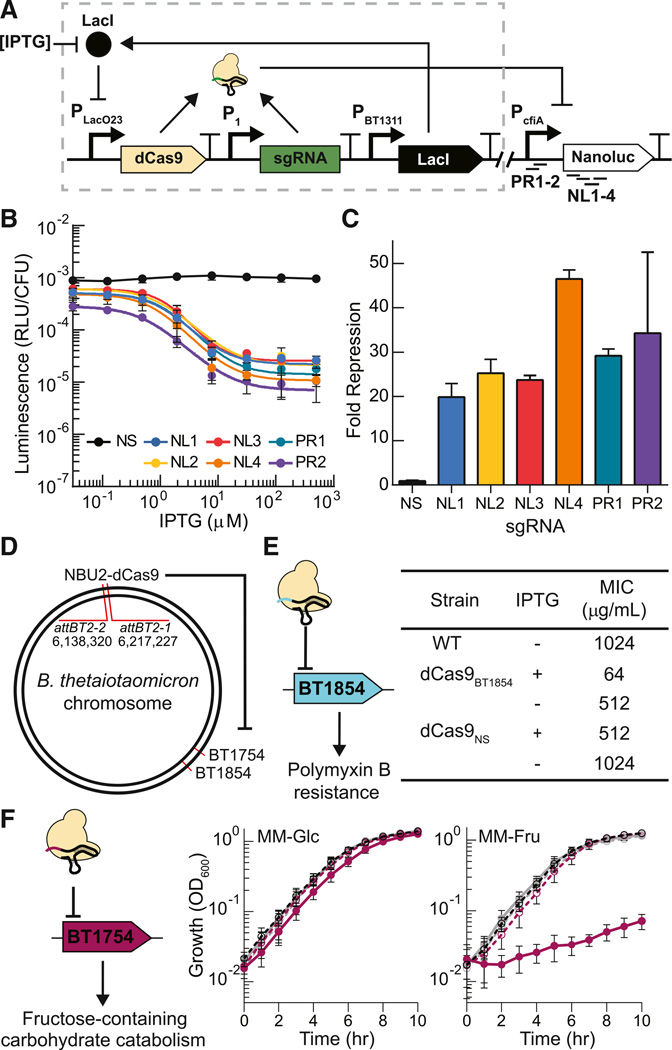
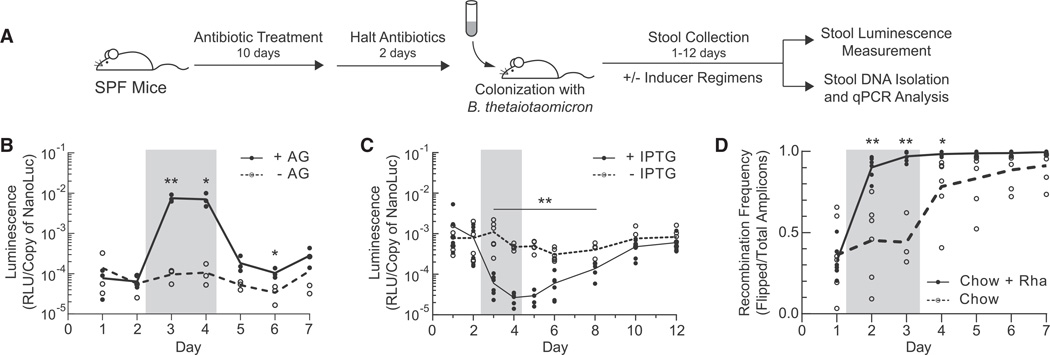
Engineering commensal organisms for challenging applications, such as modulating the gut ecosystem, is hampered by the lack of genetic parts. Here, we describe promoters, ribosome-binding sites, and inducible systems for use in the commensal bacterium Bacteroides thetaiotaomicron, a prevalent and stable resident of the human gut. We achieve up to 10,000-fold range in constitutive gene expression and 100-fold regulation of gene expression with inducible promoters and use these parts to record DNA-encoded memory in the genome. We use CRISPR interference (CRISPRi) for regulated knockdown of recombinant and endogenous gene expression to alter the metabolic capacity of B. thetaiotaomicron and its resistance to antimicrobial peptides. Finally, we show that inducible CRISPRi and recombinase systems can function in B. thetaiotaomicron colonizing the mouse gut. These results provide a blueprint for engineering new chassis and a resource to engineer Bacteroides for surveillance of or therapeutic delivery to the gut microbiome.


Figures

Figure 1
Figure 1. Genetic Parts to Control Expression in B. thetaiotaomicron
(A) The ranges of gene expression are shown for the different gene regulation systems developed in this manuscript. AG, arabinogalactan; CS, chondroitin sulfate; IPTG, isopropyl beta-D-1-thiogalactopyranoside; Rha, rhamnose; dCas9, catalytically inactive Cas9 endonuclease (B) Tyrosine integrase IntN2 catalyzes stable integration of pNBU2-based expression constructs into one of two attBT2 sites in the B. thetaiotaomicron genome (Wang et al., 2000). The two attBT2 sites (attBT2-1 at nt 6,217,227 and attBT2-2 at nt 6,138,320) are in the 3′ ends of tRNASer genes (BT_t71 and BT_t70, respectively). ApR, ampicillin resistance cassette; ErmR, erythromycin resistance cassette; RP4, origin of transfer; R6K, origin of replication; NanoLuc, luciferase (C) Constitutive promoters and ribosome binding sites for the construction of gene expression libraries. The putative −33 and −7 regions of the PBT1311 promoter, the Shine-Delgarno sequence, and the start codon are indicated by black boxes. Numbers below the black boxes represent nucleotide locations relative the PBT1311 transcription start site. The 26 bp sequence introduced in the PAM promoters is shown as blue boxes (see also Figure S1). Numbers at the edges of the blue boxes indicate the PBT1311 nucleotides replaced or the insertion site within the promoter. The location of residues randomized in the rpiL* RBS library are indicated with red arrows (for library A: nt −14, −13, −12; for library B: nt −21, −18, −15; and for library C: nt −17, −16, −11; nt numbering is relative to the translation start site). (D) Activity was measured for a set of constitutive promoters and their cognate RBSs. For PAM1, PAM2, PAM3, PAM4, the BT1311 RBS was used. Furthermore, PBT1311, PAM1, PAM2, PAM3, and PAM4 were combined with RBSs of varying strengths. Gene expression was measured using a luciferase reporter (NanoLuc) and reported as relative light units/colony forming unit (RLU/CFU). (E) Three large RBS libraries were constructed and combined with promoter PBT1311. For reference, the parent rpiL* RBS is indicated with a red arrow. The sequences of the RBSs are provided in Table S1. For (D) and (E), error bars represent the SD of three independent biological replicates made on separate days. (F) The strength of each RBS was compared to the predicted free energy of folding for the mRNA (ΔGfold). (G) A consensus strong RBS and weak RBS were generated for the rpiL* RBS library using frequency logos that included the 11 strongest and 11 weakest RBSs (residue locations are stated relative to the translation start site). Frequency logos were constructed by comparing the frequency of each nucleotide at each position in that group with the frequency of that nucleotide in that position in the full library. Position −20 and −19 were not randomized and are not shown in the frequency logos. See also Tables S1 and S2.
Figure 2
Figure 2. Design and Characterization of Genetic Sensors
(A–D) Response curves for NanoLuc under the regulated control of the rhamnose (Rha)-inducible promoters (A), chondroitin sulfate (ChS)-inducible promoters (B), arabinogalactan (AG)-inducible promoters (C), or IPTG-inducible promoters (D). LacO1 operator sites were inserted in various regions (O1, O2, O3) of the PcfxA promoter (see also Figure S2). For (D), squares indicate PLacO23 and circles indicate PLacO13. Inducer concentrations were applied as follows: 3-fold serial dilutions starting at 10 mM Rha (A); 3-fold serial dilutions starting at 0.4% for ChS (B) and AG (C); and 4-fold serial dilutions starting at 500 µM for IPTG (D). The leftmost data point in each plot represents the background luminescence in the absence of inducer. Response curves were fit to a Hill function (solid lines). (E) Orthogonality matrix of sugar-inducible genetic systems incubated with 10 mM rhamnose (Rha), 0.2% chondroitin sulfate (ChS), 0.2% arabinogalactan (AG), or 100 µM IPTG compared to no inducer. Error bars represent the SD of three biological replicates made on different days.
Figure 3
Figure 3. Synthetic Genetic Memory
(A) Integrases mediate recombination of DNA between integrase binding sites (attB/attP), resulting in the inversion of the intervening spacers. (B) Schematic of the location of the promoter-RBS-integrase system and the memory array cassettes in the B. thetaiotaomicron chromosome. (C) Integrase-mediated DNA inversion at each integrase target sequence in the memory array cassette is detected by PCR. Primer pairs (arrows) anneal to the interface of the integrase recognition sites and to the spacer region between recognition sites. PCR amplification occurs only after an inversion event (solid lines below the primer arrows indicate expected amplicons). (D) Representative PCR products are shown after recombination with integrases Int7, Int8, Int9, or Int12. – indicates no integrase, + indicates the integrase is present. PAM4-rpiL* was used to control expression of each integrase (see also Figure S3.) (E) Schematic of the rhamnose-inducible recombinase circuit. Transcriptional activator RhaR, produced from the endogenous locus, is activated in the presence of rhamnose causing expression of Int12 from PBT3763. Int12 mediates recombination between the Int12 attB and attP recognition sequences. (F) Response curve of Int12 memory circuit. Int12 was placed under the control of a subset of PBT3763-rpiL*C51. Inducer concentrations were 9-fold serial dilutions starting at 10 mM rhamnose. The leftmost data point represents the recombination in the absence of inducer. Cells were grown 8 hr at 37°C before harvesting cells and isolating DNA. Absolute quantities of flipped and unflipped memory array in genomic DNA were determined by qPCR using standard curves (Experimental Procedures). The recombination ratio is expressed as the ratio of cells containing a flipped memory array (Flipped) divided by the sum total of cells containing a flipped or unflipped array (Total). Data were fit with a Hill function to guide the eye (see also Figure S3). (G) Int12-mediated recombination versus time. Cells were induced with 10 mM rhamnose at t = 0. Absolute quantities of flipped and unflipped memory array in genomic DNA were determined by qPCR using standard curves (Experimental Procedures). Recombination ratios were determined as in (F). Data were fit with a sigmoidal dose-response function to guide the eye. For (F) and (G), error bars represent the SD of three biological replicates made on different days. See also Figure S3.
Figure 4
Figure 4. CRISPRi-Mediated Repression of Recombinant and Endogenous Genes
(A) Schematic of dCas9-based repression of NanoLuc. Addition of IPTG induces expression of dCas9, which complexes with constitutively expressed sgRNA targeting the coding sequence of NanoLuc (NL1–4) or the PcfiA promoter (PR1–2). The plasmid backbone separates the NanoLuc cassette and the IPTG-inducible CRISPRi system. (B) Response curves of dCas9-mediated targeting the coding sequence of NanoLuc (NL1–4), the promoter (PR1–2) or a nonsense sequence (NS). Fourfold serial dilutions of IPTG starting at 500 µM or no inducer were added to cultures. Response curves were fit to a Hill function (solid lines). (C) Fold repression elicited by various gRNAs in the presence (500 µM) of inducer. Bars are colored to correspond to (B). (D) Genomic location of endogenous genes targeted using CRISPRi. (E) Minimum inhibitory concentrations (MICs) of polymyxin B for cells with CRISPRi targeted against BT1854 (dCas9BT1854) compared with wild-type (WT) cells or non-specific control cells (dCas9NS). Reported values are the mode of three independent biological replicates made on three separate days. (F) CRISPRi was targeted against BT1754 (dCas9BT1754). Growth curves of wild-type (WT) (black), dCas9BT1754 (pink), or dCas9NS (gray) cells in minimal media supplemented with 0.5% glucose (MM-Glc) or 0.5% fructose (MM-Fru) in the presence (full line) or absence (dotted line) of 100 mM IPTG. Error bars represent the SD of three biological replicates made on different days.
Figure 5
Figure 5. In Vivo Function of Genetic Parts within B. thetaiotaomicron Colonizing the Mouse Gut
(A) Experimental timeline. Specific-pathogen-free (SPF) Swiss Webster mice were treated for 10 days with ciprofloxacin and metronidazole and gavaged with B. thetaiotaomicron 2 days after cessation of treatment. Bacterial gavage was administered on Day 0 (B–D). (B and C) Luciferase activity in fecal pellets of mice inoculated with strains possessing the arabinogalactan (AG)-inducible PBT0268 (B) or IPTG-inducible CRISPRi dCas9NL3 (C) systems. Mice were provided drinking water supplemented with 5% arabinogalactan (B) (solid line), or 25 mM IPTG (C) (solid line) for 2 days after stool collection on Day 2 (gray box), or were maintained on normal drinking water throughout the entire experiment (dashed lines). Inducer water was removed on Day 4 after stool collection. Luminescence values were normalized to cell density as determined by qPCR using NanoLuc-specific primers. (D) SPF mice were colonized with B. thetaiotaomicron containing the rhamnose-inducible integrase construct PBT3763-rpiL*C51-Int12. All mice were exposed to 0.3% rhamnose (w/w) in the plant-based chow. In addition, half of the mice had their drinking water supplemented with 500 mM rhamnose after stool collection on Day 1 (“Chow + Rha,” solid line) while the other half of the mice were maintained on normal drinking water throughout the entire experiment (“Chow,” dashed line). Mice receiving rhamnose-supplemented water on Days 1 and 2 (gray box) were returned to normal water on Day 3 after stool collection. Recombination ratios were determined for fecal DNA as described in Figure 3F. For day 3 “Chow” samples, n = 3. For all other days, n = 6 for both treatment groups. See also Figure S4. For (B)–(D), individual points represent independent biological replicates and the line represents the mean of the group. *p < 0.05, **p < 0.01.

References

    1. Accetto T, Avguštin G. Inability of Prevotella bryantii to form a functional Shine-Dalgarno interaction reflects unique evolution of ribosome binding sites in Bacteroidetes. PLoS ONE. 2011;6:e22914. - PMC - PubMed
    1. Bayley DP, Rocha ER, Smith CJ. Analysis of cepA and other Bacteroides fragilis genes reveals a unique promoter structure. FEMS Microbiol. Lett. 2000;193:149–154. - PubMed
    1. Bloom SM, Bijanki VN, Nava GM, Sun L, Malvin NP, Donermeyer DL, Dunne WM, Jr, Allen PM, Stappenbeck TS. Commensal Bacteroides species induce colitis in host-genotype-specific fashion in a mouse model of inflammatory bowel disease. Cell Host Microbe. 2011;9:390–403. - PMC - PubMed
    1. Boni IV, Isaeva DM, Musychenko ML, Tzareva NV. Ribosome-messenger recognition: mRNA target sites for ribosomal protein S1. Nucleic Acids Res. 1991;19:155–162. - PMC - PubMed
    1. Bonnet J, Yin P, Ortiz ME, Subsoontorn P, Endy D. Amplifying genetic logic gates. Science. 2013;340:599–603. - PubMed