Comparative Study
. 2016 Feb 26;11(2):e0150251.
doi: 10.1371/journal.pone.0150251. eCollection 2016.

Analysis of Transcriptional Signatures in Response to Listeria monocytogenes Infection Reveals Temporal Changes That Result from Type I Interferon Signaling

Affiliations
Comparative Study

Analysis of Transcriptional Signatures in Response to Listeria monocytogenes Infection Reveals Temporal Changes That Result from Type I Interferon Signaling

Jonathan M Pitt et al. PLoS One. .

Abstract

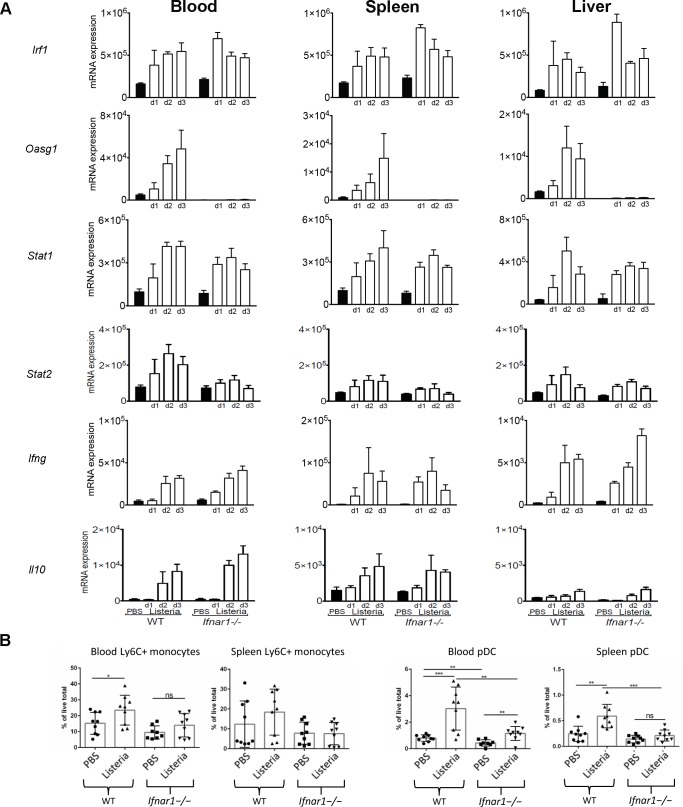
Analysis of the mouse transcriptional response to Listeria monocytogenes infection reveals that a large set of genes are perturbed in both blood and tissue and that these transcriptional responses are enriched for pathways of the immune response. Further we identified enrichment for both type I and type II interferon (IFN) signaling molecules in the blood and tissues upon infection. Since type I IFN signaling has been reported widely to impair bacterial clearance we examined gene expression from blood and tissues of wild type (WT) and type I IFNαβ receptor-deficient (Ifnar1-/-) mice at the basal level and upon infection with L. monocytogenes. Measurement of the fold change response upon infection in the absence of type I IFN signaling demonstrated an upregulation of specific genes at day 1 post infection. A less marked reduction of the global gene expression signature in blood or tissues from infected Ifnar1-/- as compared to WT mice was observed at days 2 and 3 after infection, with marked reduction in key genes such as Oasg1 and Stat2. Moreover, on in depth analysis, changes in gene expression in uninfected mice of key IFN regulatory genes including Irf9, Irf7, Stat1 and others were identified, and although induced by an equivalent degree upon infection this resulted in significantly lower final gene expression levels upon infection of Ifnar1-/- mice. These data highlight how dysregulation of this network in the steady state and temporally upon infection may determine the outcome of this bacterial infection and how basal levels of type I IFN-inducible genes may perturb an optimal host immune response to control intracellular bacterial infections such as L. monocytogenes.


Conflict of interest statement

Competing Interests: The authors have declared that no competing interests exist.

Figures

Fig 1
Fig 1. Transcriptional response following L. monocytogenes infection of WT mice in blood and spleen.
(A, B) Heatmaps of the significantly regulated blood and spleen transcripts at day 3 following intravenous injection of C57BL/6 WT mice with 5 × 10³ of L. monocytogenes (p < 0.01 after unpaired t-test with Benjamini–Hochberg multiple testing correction on transcripts passing quality control filtering, n = 10 mice/group). The top five QIAGEN Ingenuity® Pathway Analysis (IPA®) canonical pathways by significance (Fisher’s exact test) for upregulated (red bars) or downregulated (blue bars) genes are listed below the heatmaps. (C) qRT-PCR data on selected transcripts normalized relative to Hprt1 expression levels (mean with SD, n = 5 mice/group). Samples are from the same experiment as the microarray data. (D) CD3+Thy1+ cells in blood and spleen as a percentage of total live cells. Pooled results are from triplicates of 3 independent experiments (mean with SEM, n = 3 mice/group/experiment).
Fig 2
Fig 2. L. monocytogenes infection modulates a number of IFN signaling pathway and IFN response genes in the blood and spleen.
(A) The IFN signaling pathway (QIAGEN Ingenuity® Pathway Analysis) was overlaid with the day 3 post infection blood genes shown in Fig 1A. Genes (IFNαβ and JAK1) with opposite expression patterns between blood and spleen are highlighted with black circles. Red: upregulated, Blue: downregulated. (B) IFN response genes (type I, type II, and type I and II) associated with blood and spleen transcripts reported in Fig 1A and 1B and the Interferome database (www.interferome.org) were quantitated.
Fig 3
Fig 3. Tissue-specific transcriptional responses of WT and Ifnar1-/- mice in blood, spleen and liver following L. monocytogenes infection at different time points and bacterial loads.
(A) Colony forming unit (CFU) values were assessed from the spleen and liver of C57BL/6 WT and Ifnar1-/- mice at day 1, day 2 and day 3 following intravenous injection with 5 × 10³ of L. monocytogenes (mean with SEM, n = 4 or 5 mice/group). (B) Heatmap representations of differentially expressed transcripts at different times (days 1, 2 and 3) in blood, spleen, liver from WT and Ifnar1-/- infected mice relative to uninfected controls (p < 0.05 after 2-way ANOVA with Benjamini–Hochberg multiple testing correction on transcripts passing quality control filtering, n = 3 or 4 mice/group). (C) Percentage of transcripts that were significant for infection alone, strain alone or involving a combination of strain and infection across the different tissues and the infection time course. (D) Venn diagrams showing temporal differences and similarities in gene expression in blood, spleen and liver after infection.
Fig 4
Fig 4. Canonical pathways associated with blood transcripts that are differentially expressed in L. monocytogenes infected WT versus Ifnar1-/- mice against control uninfected WT mice.
Top IPA® canonical pathways that are associated with differentially expressed blood day 1, day 2 and day 3 transcripts shown in Fig 3B and that pass a further 1.5-fold change filter ratio between (A) WT infected to WT uninfected; (B) KO infected to WT uninfected; and (C) (WT infected to WT uninfected) as compared to (KO infected to WT uninfected). Percent pathway modulation relative to each dataset and pathway size is indicated in red for up-regulated and blue for down-regulated genes. Pathway rank for pathways passing p<0.05 after Fisher’s Exact test at each time-point is marked. (D and E) Detailed heat map of differentially expressed genes found in the (D) Interferon Signaling Pathway; and (E) Antigen Presentation Pathway.
Fig 5
Fig 5. Canonical pathways associated with blood transcripts that are differentially expressed in L. monocytogenes infected Ifnar1-/- versus WT mice against control uninfected Ifnar1-/- mice.
Top IPA® canonical pathways that are associated with differentially expressed blood day 1, day 2 and day 3 transcripts from Fig 3B and pass a further 1.5-fold change filter ratio between (A) WT infected to KO uninfected; (B) KO infected to KO uninfected; and (C) (KO infected to KO uninfected) as compared to (WT infected to KO uninfected). Percent pathway modulation relative to each dataset and pathway size is indicated in red for up-regulated and blue for down-regulated genes. Pathway rank for pathways passing p<0.05 after Fisher’s Exact test at each time-point is marked. (D and E) Detailed heat map of differentially expressed genes found in the (D) Interferon Signaling Pathway; and (E) Antigen Presentation Pathway.
Fig 6
Fig 6. Validation of several IFN regulated genes by qRT-PCR.
(A) qRT-PCR validation of several IFN regulated genes identified in Figs 4 and 5. Blood (left panel), spleen (middle panel) and liver (right panel) RNA was extracted at the indicated times post L. monocytogenes infection. RNA was reverse transcribed to cDNA, and expression of the indicated genes was analyzed by qRT-PCR. Values were normalized relative to Hprt1 expression levels (mean with SD). Data are from one experiment with four mice per group. (B) Ly6C+ monocytes and pDC in blood and spleen of uninfected and infected WT and Ifnar1-/- mice as a percentage of total live cells. Pooled results from 3 independent experiments, mean with SEM, n = 3 per group/experiment.
Fig 7
Fig 7. Ifnar1-/- uninfected mice show a lowered expression of several IFN regulated genes as compared with WT uninfected mice.
(A–C) The strain-associated subsets of transcripts identified from the 2-way ANOVA as in Fig 3B for an independent experiment were filtered to identify baseline differences (fold-ratio of 1.5 between day 3 uninfected Ifnar1-/- to day 3 uninfected WT mice) for blood, spleen and liver. Heatmaps and a list of top three IPA® canonical pathways are shown. (D) Venn diagram of above detailed transcripts identifies 50 transcripts that are commonly shared between blood, spleen and liver. These transcripts map to 35 genes in IPA® and include a number of Interferome-based type I IFN responsive genes that are marked in red. (E) Heatmap of mean-normalised expression values for selected (Irf1, Irf3, Irf7, Irf9, Stat1 and Stat2) IFN transcriptional regulator transcripts. (F) qRT-PCR validation of Irf7 gene normalized relative to Hprt1 gene in blood (left panel), spleen (middle panel) and liver (right panel) at indicated times post infection (mean with SD). Data from one experiment with four mice per group.
Fig 8
Fig 8. IFN response genes show differential early and delayed expression patterns following L. monocytogenes infection in WT and Ifnar1-/- mice.
(A) Heatmaps of IFN-response genes (type I, type II, and type I and II) associated with blood, spleen and liver transcripts reported in Fig 3B and the Interferome database are shown. Total numbers of IFN-response genes identified across each of the three tissues and their time-course distribution are shown at far right. (B) Venn diagrams showing temporal differences and similarities in the expression of IFN-response genes in blood, spleen and liver. (C) Weighted molecular scores of the identified IFN-response genes calculated relative to uninfected WT mice. (D) The distribution of IFN-response genes within blood, spleen and liver of infected and uninfected mice at individual times post infection.

References

    1. Hamon M, Bierne H, Cossart P. Listeria monocytogenes: a multifaceted model. Nature reviews Microbiology. 2006;4(6):423–34. 10.1038/nrmicro1413 . - DOI - PubMed
    1. Lorber B. Listeriosis. Clin Infect Dis. 1997;24(1):1–9; quiz 10–1. . - PubMed
    1. Pamer EG. Immune responses to Listeria monocytogenes. Nature reviews Immunology. 2004;4(10):812–23. 10.1038/nri1461 . - DOI - PubMed
    1. Witte CE, Archer KA, Rae CS, Sauer JD, Woodward JJ, Portnoy DA. Innate immune pathways triggered by Listeria monocytogenes and their role in the induction of cell-mediated immunity. Advances in immunology. 2012;113:135–56. 10.1016/B978-0-12-394590-7.00002-6 . - DOI - PubMed
    1. Aubry C, Corr SC, Wienerroither S, Goulard C, Jones R, Jamieson AM, et al. Both TLR2 and TRIF contribute to interferon-beta production during Listeria infection. PloS one. 2012;7(3):e33299 10.1371/journal.pone.0033299 - DOI - PMC - PubMed

Publication types