. 2016 Oct;18(10):1429-43.
doi: 10.1111/cmi.12584. Epub 2016 May 25.

Host and parasite genetics shape a link between Trypanosoma cruzi infection dynamics and chronic cardiomyopathy

Affiliations

Host and parasite genetics shape a link between Trypanosoma cruzi infection dynamics and chronic cardiomyopathy

Michael D Lewis et al. Cell Microbiol. 2016 Oct.

Abstract

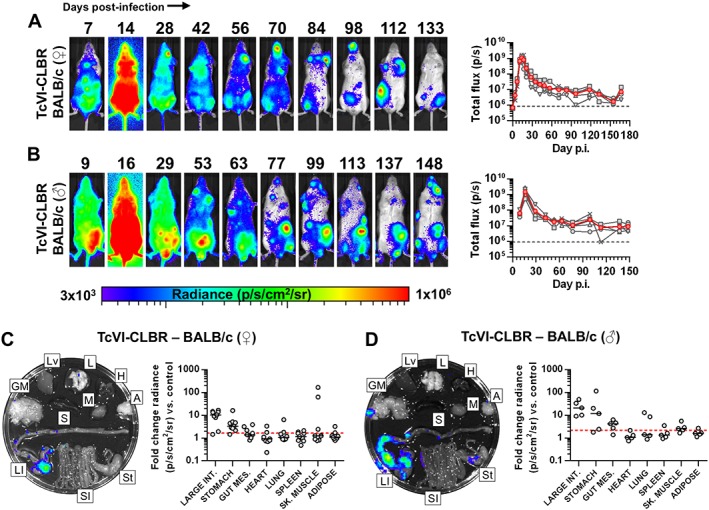
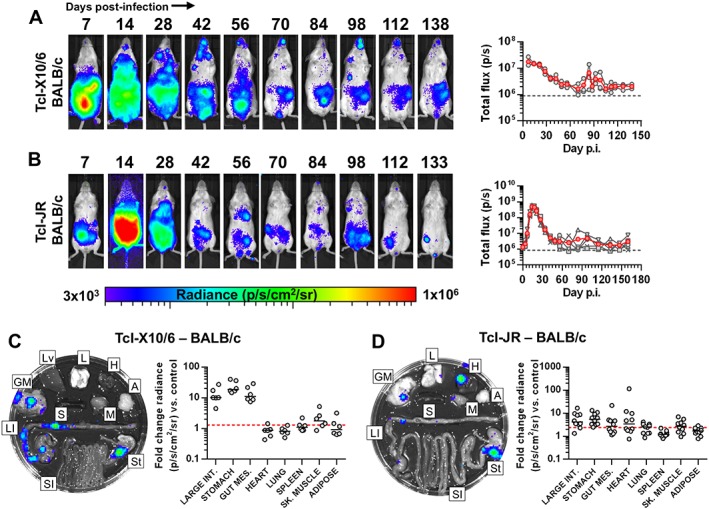
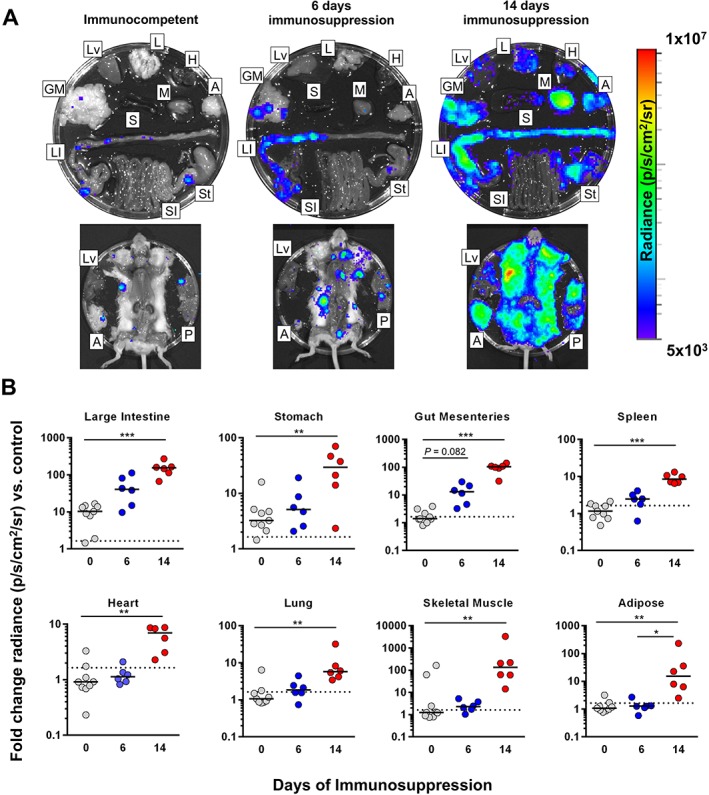
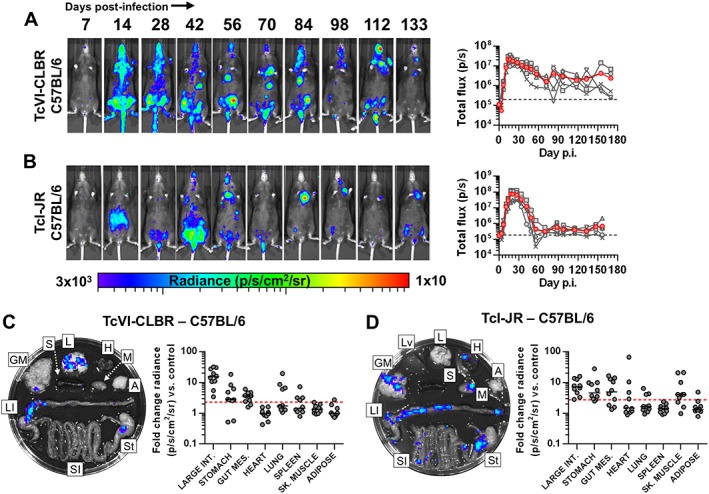
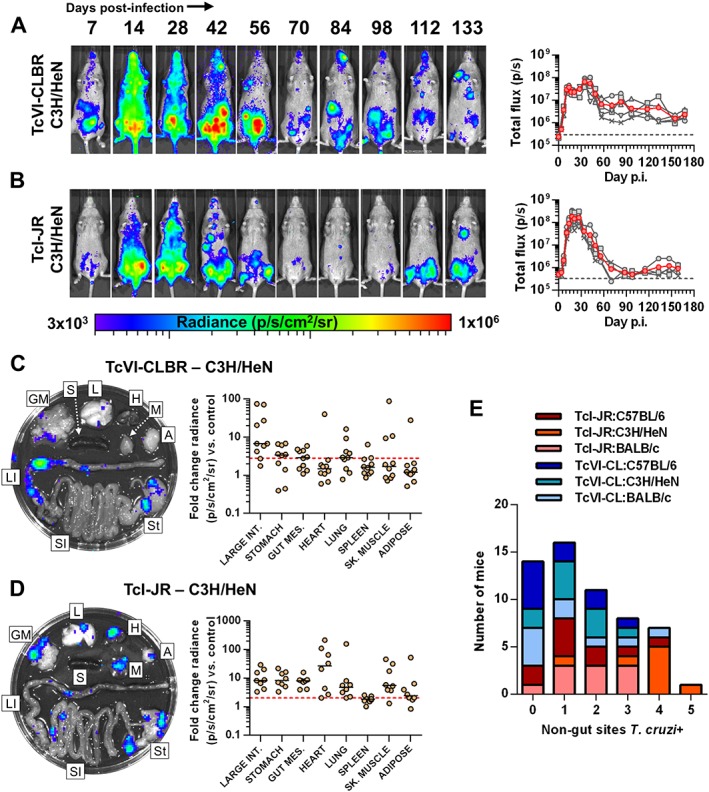
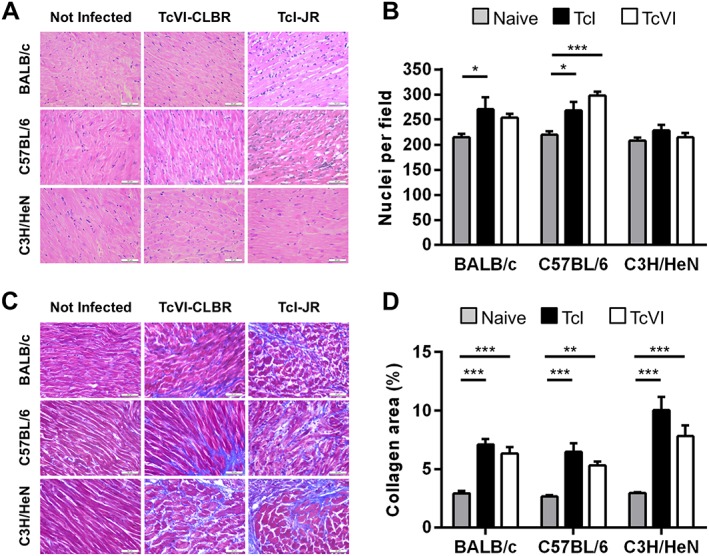
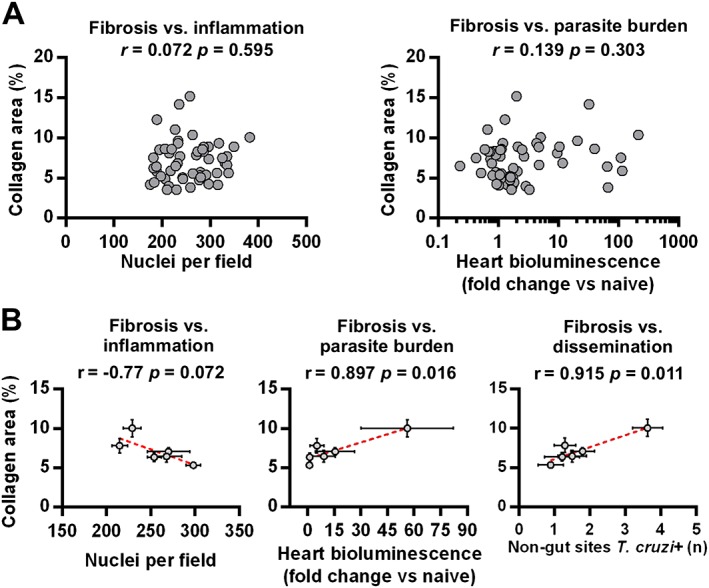
Host and parasite diversity are suspected to be key factors in Chagas disease pathogenesis. Experimental investigation of underlying mechanisms is hampered by a lack of tools to detect scarce, pleiotropic infection foci. We developed sensitive imaging models to track Trypanosoma cruzi infection dynamics and quantify tissue-specific parasite loads, with minimal sampling bias. We used this technology to investigate cardiomyopathy caused by highly divergent parasite strains in BALB/c, C3H/HeN and C57BL/6 mice. The gastrointestinal tract was unexpectedly found to be the primary site of chronic infection in all models. Immunosuppression induced expansion of parasite loads in the gut and was followed by widespread dissemination. These data indicate that differential immune control of T. cruzi occurs between tissues and shows that the large intestine and stomach provide permissive niches for active infection. The end-point frequency of heart-specific infections ranged from 0% in TcVI-CLBR-infected C57BL/6 to 88% in TcI-JR-infected C3H/HeN mice. Nevertheless, infection led to fibrotic cardiac pathology in all models. Heart disease severity was associated with the model-dependent frequency of dissemination outside the gut and inferred cumulative heart-specific parasite loads. We propose a model of cardiac pathogenesis driven by periodic trafficking of parasites into the heart, occurring at a frequency determined by host and parasite genetics.


Figures

Figure 1
Figure 1
Bioluminescence imaging of T. cruzi TcVI‐CLBR in BALB/c mice reveals infection kinetics and gastrointestinal persistence. A, B. Course of TcVI‐CLBR infection in female (n = 10) (A) and male (n = 5) (B) BALB/c mice tracked by in vivo bioluminescence imaging. Panels show serial ventral images of one mouse. Log‐scale pseudocolour heat maps show intensity of bioluminescence; minimum and maximum radiances are indicated. Charts show total bioluminescence for five individual mice (grey) and their mean (red) from the experiment(s) represented by adjacent images. Dashed line indicates detection threshold. C, D. Quantification of tissue‐specific chronic parasite densities in female (n = 9, 167–168 dpi) (C) and male (n = 5, 151 dpi) (D) BALB/c mice using ex vivo bioluminescence imaging. Images show bioluminescence intensities for a representative mouse: Adipose (A), gut mesenteric tissue (GM), heart (H), lung (L), large intestine (LI), liver (Lv), skeletal muscle (M), spleen (S), small intestine (SI) and stomach (St). Charts show quantification of tissue‐specific infection intensities expressed as fold change in bioluminescence versus matching tissues from uninfected controls. Black lines show median values and red dashed lines indicate detection threshold. Data are from two independent experiments (female) and one experiment (male).
Figure 2
Figure 2
T. cruzi TcI infection kinetics in BALB/c mice culminate in gastrointestinal persistence and sporadic heart infection. A, B. Course of T. cruzi TcI‐X10/6 (n = 6) (A) and TcI‐JR (n = 10) (B) infection in BALB/c mice tracked by in vivo bioluminescence imaging. Panels show serial ventral images of one mouse. Log‐scale pseudocolour heat maps show intensity of bioluminescence; minimum and maximum radiances are indicated. Charts show total bioluminescence for five individual mice (grey) and their mean (red) from the experiments represented by adjacent images. Dashed line indicates detection threshold. C, D. Quantification of tissue‐specific chronic parasite densities in TcI‐X10/6 (n = 6, 141–146 dpi) (C) and TcI‐JR (n = 10, 154–161 dpi) (D) infected BALB/c mice using ex vivo bioluminescence imaging. Images show bioluminescence intensities for a representative mouse: Adipose (A), gut mesenteric tissue (GM), heart (H), lung (L), large intestine (LI), liver (Lv), skeletal muscle (M), spleen (S), small intestine (SI) and stomach (St). Charts show quantification of tissue‐specific infection intensities expressed as fold change in bioluminescence vs. matching tissues from uninfected controls. Black lines show median values and red dashed lines indicate detection threshold. Data are from two independent experiments.
Figure 3
Figure 3
Immunosuppression leads to systemic parasite dissemination. A, B. Tissue‐specific chronic TcVI‐CLBR parasite distributions and densities in BALB/c mice after 6 (n = 6) or 14 (n = 6) days of cyclophosphamide‐induced immunosuppression compared with immunocompetent controls (n = 9). Representative images (A) show ex vivo bioluminescence intensities for samples from a representative mouse in each group: Adipose (A), gut mesenteric tissue (GM), heart (H), lung (L), large intestine (LI), liver (Lv), skeletal muscle (M), peritoneum (P), spleen (S), small intestine (SI) and stomach (St). Log‐scale heat maps indicate bioluminescence intensity; minimum and maximum radiances for pseudocolour scale are indicated. Charts (B) show infection intensities expressed as fold change in bioluminescence intensity compared with matching tissues from uninfected controls. Black lines indicate median values. Dashed lines indicate background luminescence cut‐offs equal to the mean + 2 SD of the fold change in bioluminescence intensity for empty regions of interest (ROI) compared with empty ROI in images obtained for uninfected mice. Asterisks indicate p‐values for Kruskal–Wallis tests between groups (*P < 0.05; **P < 0.01; ***P < 0.001). Data are from two independent experiments.
Figure 4
Figure 4
T. cruzi TcI‐JR and TcVI‐CLBR have similar infection dynamics in C57BL/6 mice including chronic gut persistence. A, B. Course of T. cruzi TcVI‐CLBR (n = 10) (A) and TcI‐JR (n = 10) (B) infection in C57BL/6 mice tracked by in vivo bioluminescence imaging. Panels show serial ventral images of one mouse. Log‐scale pseudocolour heat‐maps show intensity of bioluminescence; minimum and maximum radiances are indicated. Charts show total bioluminescence for five individual mice (grey) and their mean (red) from the experiments represented by adjacent images. Dashed line indicates detection threshold. C, D. Quantification of tissue‐specific chronic parasite densities in TcVI‐CLBR (n = 10, 170–175 dpi) (C) and TcI‐JR (n = 10, 156–158 dpi) (D) infected C57BL/6 mice using ex vivo bioluminescence imaging. Images show bioluminescence intensities for a representative mouse: Adipose (A), gut mesenteric tissue (GM), heart (H), lung (L), large intestine (LI), liver (Lv), skeletal muscle (M), spleen (S), small intestine (SI) and stomach (St). Charts show quantification of tissue‐specific infection intensities expressed as fold change in bioluminescence versus matching tissues from uninfected controls. Black lines show median values and red dashed lines indicate detection threshold. Data are from two independent experiments.
Figure 5
Figure 5
Distinct T. cruzi TcI‐JR and TcVI‐CLBR infection dynamics in C3H/HeN mice. A, B. Course of T. cruzi TcVI‐CLBR (n = 10) (A) and TcI‐JR (n = 10) (B) infection in C3H/HeN mice tracked by in vivo bioluminescence imaging. Panels show serial ventral images of one mouse. Log‐scale pseudocolour heat maps show intensity of bioluminescence; minimum and maximum radiances are indicated. Charts show total bioluminescence for five individual mice (grey) and their mean (red) from the experiments represented by adjacent images. Dashed line indicates detection threshold. C, D. Quantification of tissue‐specific chronic parasite densities in TcVI‐CLBR (n = 10, 154–160 dpi) (C) and TcI‐JR (n = 8, 168–174 dpi) (D) infected C3H/HeN mice using ex vivo bioluminescence imaging. Images show bioluminescence intensities for a representative mouse: Adipose (A), gut mesenteric tissue (GM), heart (H), lung (L), large intestine (LI), liver (Lv), skeletal muscle (M), spleen (S), small intestine (SI) and stomach (St). Charts show quantification of tissue‐specific infection intensities expressed as fold change in bioluminescence vs. matching tissues from uninfected controls. Black lines show median values and red dashed lines indicate detection threshold. E: Number of infected tissues outside the GI tract compared with equivalently infected BALB/c, and C57BL/6 mice at experimental end‐points. Hearts, lungs, spleens, adipose and skeletal muscle samples above threshold ex vivo bioluminescence were scored as T. cruzi positive. Data are from two independent experiments.
Figure 6
Figure 6
Variable chronic cardiac pathology across host‐parasite strain combinations. A. Representative myocardial sections stained with haematoxylin‐eosin, magnification 400×, scale bar = 50 µm. B. Quantitative histopathological analysis of myocardium samples obtained at 154–174 days of T. cruzi infection from the following groups: TcVI‐CLBR‐BALB/c (n = 9), TcVI‐CLBR‐C57BL/6 (n = 10), TcVI‐CLBR‐C3H/HeN (n = 10), TcI‐JR‐BALB/c (n = 10), TcI‐JR‐C57BL/6 (n = 10), TcI‐JR‐C3H/HeN (n = 8), uninfected control BALB/c, C57BL.6 and C3H/HeN (all n = 10). Number of nuclei per 6 × 104 µm2 were quantified as a marker of the extent of cellular infiltration. C. Representative myocardial sections stained with Masson's trichrome, magnification 400×, scale bar = 50 µm. D. Quantification of collagen content (% blue area in Masson's trichrome stained sections) as a marker of cardiac fibrosis severity in same groups as in (B). Data are the means + SEM and are from two experiments. Asterisks indicate p‐values for one way ANOVA comparisons between groups (*P < 0.05; **P < 0.01; ***P < 0.001).
Figure 7
Figure 7
Correlates of chronic heart pathology in T. cruzi infected mice. A. Pearson correlation analysis of myocarditis scores (left) and cardiac end‐point parasite densities (ex vivo bioluminescence intensities) (right) against cardiac fibrosis scores. Data are from samples obtained at 154–174 days of T. cruzi infection from the following groups: TcVI‐CLBR‐BALB/c (n = 9), TcVI‐CLBR‐C57BL/6 (n = 10), TcVI‐CLBR‐C3H/HeN (n = 10), TcI‐JR‐BALB/c (n = 10), TcI‐JR‐C57BL/6 (n = 10) and TcI‐JR‐C3H/HeN (n = 8). B. Pearson correlation analysis of group mean cardiac fibrosis scores against group mean myocarditis scores (left), cardiac end‐point parasite densities (ex vivo bioluminescence intensities) (middle) and number of ex vivo T. cruzi bioluminescence positive non‐gut tissues as an indicator of dissemination level (right). Data are from the same groups as in (A). Error bars show SEM. Dashed lines are linear regression models.

References

    1. Adad, S.J. , Andrade, D.C.d.S. , Lopes, E.R. , and Chapadeiro, E. (1991) Contribuição ao estudo da anatomia patológica do megaesôfago chagásico. Rev I Med Trop 33: 443–450. - PubMed
    1. Albareda, M.C. , De Rissio, A.M. , Tomas, G. , Serjan, A. , Alvarez, M.G. , Viotti, R. , et al. (2013) Polyfunctional T cell responses in children in early stages of chronic Trypanosoma cruzi infection contrast with monofunctional responses of long‐term infected adults. PLoS Negl Trop Dis 7: e2575. - PMC - PubMed
    1. Andrade, S.G. (1990) Influence of Trypanosoma cruzi strain on the pathogenesis of chronic myocardiopathy in mice. Mem Inst Oswaldo Cruz 85: 17–27. - PubMed
    1. Añez, N. , Carrasco, H. , Parada, H. , Crisante, G. , Rojas, A. , Fuenmayor, C. , et al. (1999) Myocardial parasite persistence in chronic chagasic patients. Am J Trop Med Hyg 60: 726–732. - PubMed
    1. Bern, C. (2011) Antitrypanosomal therapy for chronic Chagas' disease. New Engl J Med 364: 2527–2534. - PubMed

Publication types