

Metformin attenuates transforming growth factor beta (TGF-β) mediated oncogenesis in mesenchymal stem-like/claudin-low triple negative breast cancer
- PMID: 26919310
- PMCID: PMC4889288
- DOI: 10.1080/15384101.2016.1152432
Metformin attenuates transforming growth factor beta (TGF-β) mediated oncogenesis in mesenchymal stem-like/claudin-low triple negative breast cancer
Abstract
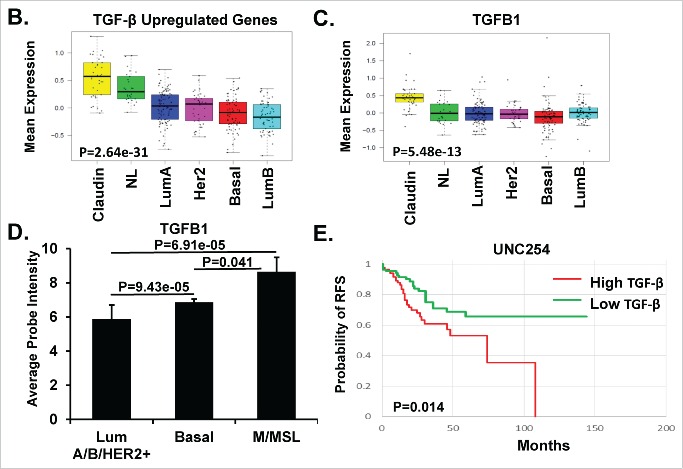
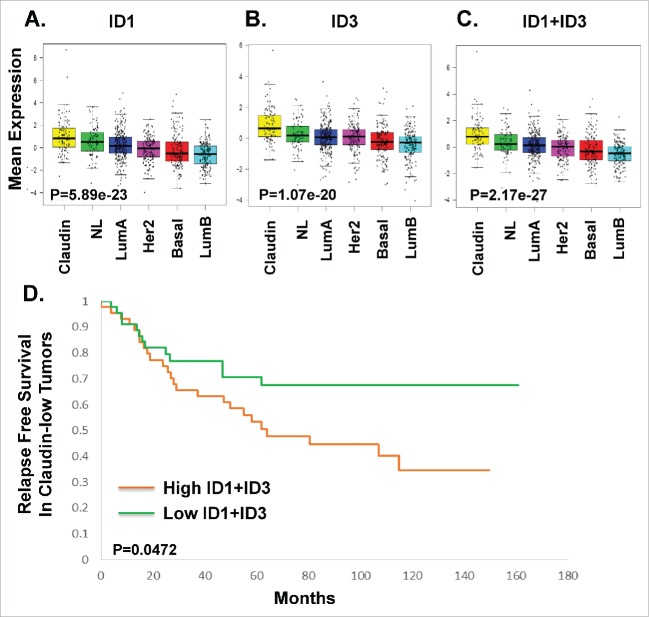
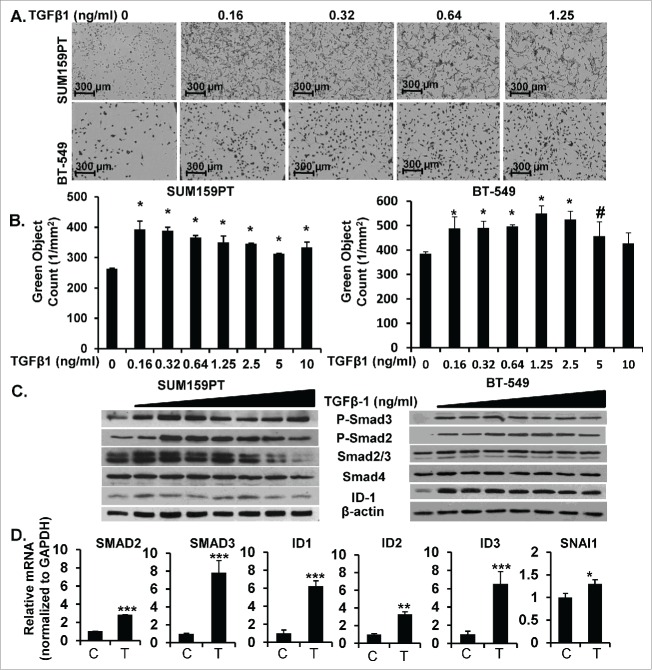
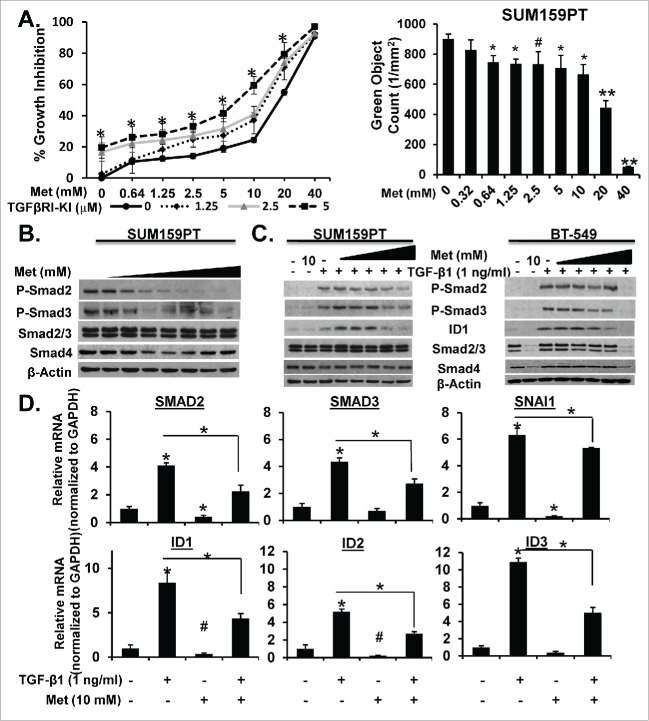
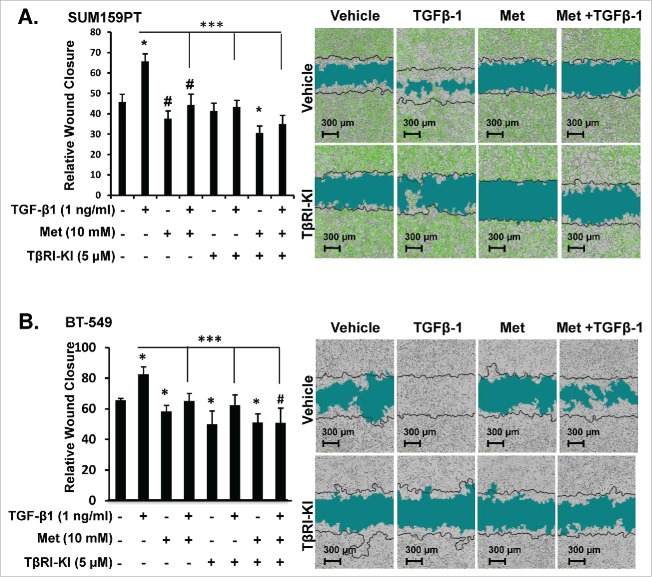
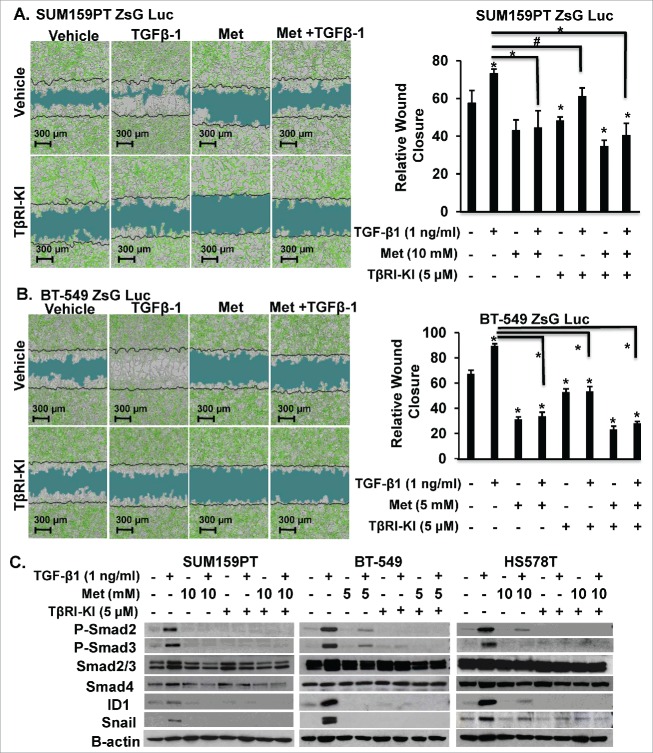
Mesenchymal stem-like/claudin-low (MSL/CL) breast cancers are highly aggressive, express low cell-cell adhesion cluster containing claudins (CLDN3/CLDN4/CLDN7) with enrichment of epithelial-to-mesenchymal transition (EMT), immunomodulatory, and transforming growth factor-β (TGF-β) genes. We examined the biological, molecular and prognostic impact of TGF-β upregulation and/or inhibition using in vivo and in vitro methods. Using publically available breast cancer gene expression databases, we show that upregulation and enrichment of a TGF-β gene signature is most frequent in MSL/CL breast cancers and is associated with a worse outcome. Using several MSL/CL breast cancer cell lines, we show that TGF-β elicits significant increases in cellular proliferation, migration, invasion, and motility, whereas these effects can be abrogated by a specific inhibitor against TGF-β receptor I and the anti-diabetic agent metformin, alone or in combination. Prior reports from our lab show that TNBC is exquisitely sensitive to metformin treatment. Mechanistically, metformin blocks endogenous activation of Smad2 and Smad3 and dampens TGF-β-mediated activation of Smad2, Smad3, and ID1 both at the transcriptional and translational level. We report the use of ID1 and ID3 as clinical surrogate markers, where high expression of these TGF-β target genes was correlated to poor prognosis in claudin-low patients. Given TGF-β's role in tumorigenesis and immunomodulation, blockade of this pathway using direct kinase inhibitors or more broadly acting inhibitors may dampen or abolish pro-carcinogenic and metastatic signaling in patients with MCL/CL TNBC. Metformin therapy (with or without other agents) may be a heretofore unrecognized approach to reduce the oncogenic activities associated with TGF-β mediated oncogenesis.
Keywords: Breast cancer; TGF-β; claudin-low; mesenchymal; mesenchymal stem-like; metformin; triple negative breast cancer (TNBC).
Figures
Similar articles
-
Transforming growth factor beta receptor type III is a tumor promoter in mesenchymal-stem like triple negative breast cancer.Breast Cancer Res. 2014 Jul 1;16(4):R69. doi: 10.1186/bcr3684. Breast Cancer Res. 2014. PMID: 24985072 Free PMC article.
-
Loss of RAB1B promotes triple-negative breast cancer metastasis by activating TGF-β/SMAD signaling.Oncotarget. 2015 Jun 30;6(18):16352-65. doi: 10.18632/oncotarget.3877. Oncotarget. 2015. PMID: 25970785 Free PMC article.
-
PCK2 promotes invasion and epithelial-to-mesenchymal transition in triple-negative breast cancer by promoting TGF-β/SMAD3 signaling through inhibiting TRIM67-mediated SMAD3 ubiquitination.Cancer Biol Ther. 2025 Dec;26(1):2478670. doi: 10.1080/15384047.2025.2478670. Epub 2025 Mar 13. Cancer Biol Ther. 2025. PMID: 40081967 Free PMC article.
-
Overexpression of matrix metalloproteinase-9 in breast cancer cell lines remarkably increases the cell malignancy largely via activation of transforming growth factor beta/SMAD signalling.Cell Prolif. 2019 Sep;52(5):e12633. doi: 10.1111/cpr.12633. Epub 2019 Jul 2. Cell Prolif. 2019. PMID: 31264317 Free PMC article. Review.
-
The hedgehog pathway in triple-negative breast cancer.Cancer Med. 2016 Oct;5(10):2989-3006. doi: 10.1002/cam4.833. Epub 2016 Aug 18. Cancer Med. 2016. PMID: 27539549 Free PMC article. Review.
Cited by
-
Sarcopenia and Diabetes: A Detrimental Liaison of Advancing Age.Nutrients. 2023 Dec 25;16(1):63. doi: 10.3390/nu16010063. Nutrients. 2023. PMID: 38201893 Free PMC article. Review.
-
Clinically Translatable Approaches of Inhibiting TGF-β to Target Cancer Stem Cells in TNBC.Biomedicines. 2021 Oct 4;9(10):1386. doi: 10.3390/biomedicines9101386. Biomedicines. 2021. PMID: 34680503 Free PMC article. Review.
-
Epithelial to mesenchymal transition and microRNA expression are associated with spindle and apocrine cell morphology in triple-negative breast cancer.Sci Rep. 2021 Mar 4;11(1):5145. doi: 10.1038/s41598-021-84350-2. Sci Rep. 2021. PMID: 33664322 Free PMC article.
-
[Metformin and malignant neoplasms: a possible mechanism of antitumor action and prospects for use in practice].Probl Endokrinol (Mosk). 2022 Jul 14;68(5):45-55. doi: 10.14341/probl13097. Probl Endokrinol (Mosk). 2022. PMID: 36337018 Free PMC article. Russian.
-
A ROS/Akt/NF-κB Signaling Cascade Mediates Epidermal Growth Factor-Induced Epithelial-Mesenchymal Transition and Invasion in Human Breast Cancer Cells.World J Oncol. 2022 Oct;13(5):289-298. doi: 10.14740/wjon1518. Epub 2022 Oct 22. World J Oncol. 2022. PMID: 36406192 Free PMC article.
References
-
- Cheang MC, Voduc D, Bajdik C, Leung S, McKinney S, Chia SK, Perou CM, Nielsen TO. Basal-like breast cancer defined by five biomarkers has superior prognostic value than triple-negative phenotype. Clin Cancer Res 2008; 14(5):1368-76; PMID:18316557; http://dx.doi.org/10.1158/1078-0432.CCR-07-1658 - DOI - PubMed
-
- Foulkes WD, Smith IE, Reis-Filho JS. Triple-negative breast cancer. N Engl J Med 2010; 363(20):1938-48; PMID:21067385; http://dx.doi.org/10.1056/NEJMra1001389 - DOI - PubMed
-
- Lehmann BD, Pietenpol JA. Identification and use of biomarkers in treatment strategies for triple-negative breast cancer subtypes. J Pathol 2014; 232(2):142-50; PMID:24114677; http://dx.doi.org/10.1002/path.4280 - DOI - PMC - PubMed
-
- Lehmann BD, Bauer JA, Chen X, Sanders ME, Chakravarthy AB, Shyr Y, Pietenpol JA. Identification of human triple-negative breast cancer subtypes and preclinical models for selection of targeted therapies. J Clin Invest 2011; 121(7):2750-67; PMID:21633166; http://dx.doi.org/10.1172/JCI45014 - DOI - PMC - PubMed
-
- Perou CM. Molecular stratification of triple-negative breast cancers. Oncologist 2010; 15 Supp l5:39-48; PMID:21138954; http://dx.doi.org/10.1634/theoncologist.2010-S5-39 - DOI - PubMed
Publication types
MeSH terms
Substances
Grants and funding
LinkOut - more resources
Full Text Sources
Other Literature Sources
Miscellaneous