. 2016 Feb 25;164(5):1060-1072.
doi: 10.1016/j.cell.2016.01.015.

New Brain Tumor Entities Emerge from Molecular Classification of CNS-PNETs

Dominik Sturm #  1   2 Brent A Orr #  3 Umut H Toprak #  4 Volker Hovestadt #  5 David T W Jones  1 David Capper  6   7 Martin Sill  8 Ivo Buchhalter  4 Paul A Northcott  1 Irina Leis  6 Marina Ryzhova  9 Christian Koelsche  6   7 Elke Pfaff  1   2 Sariah J Allen  3 Gnanaprakash Balasubramanian  10 Barbara C Worst  1   2 Kristian W Pajtler  1 Sebastian Brabetz  1 Pascal D Johann  1   2 Felix Sahm  6   7 Jüri Reimand  11   12 Alan Mackay  13 Diana M Carvalho  13 Marc Remke  14 Joanna J Phillips  15   16   17 Arie Perry  15   16   17 Cynthia Cowdrey  15 Rachid Drissi  18 Maryam Fouladi  18 Felice Giangaspero  19   20 Maria Łastowska  21 Wiesława Grajkowska  21 Wolfram Scheurlen  22 Torsten Pietsch  23 Christian Hagel  24 Johannes Gojo  25   26 Daniela Lötsch  26 Walter Berger  26 Irene Slavc  25 Christine Haberler  27 Anne Jouvet  28 Stefan Holm  29 Silvia Hofer  30 Marco Prinz  31 Catherine Keohane  32 Iris Fried  33 Christian Mawrin  34 David Scheie  35 Bret C Mobley  36 Matthew J Schniederjan  37 Mariarita Santi  38 Anna M Buccoliero  39 Sonika Dahiya  40 Christof M Kramm  41 André O von Bueren  41 Katja von Hoff  42 Stefan Rutkowski  42 Christel Herold-Mende  43 Michael C Frühwald  44 Till Milde  2   45 Martin Hasselblatt  46 Pieter Wesseling  47   48 Jochen Rößler  49 Ulrich Schüller  50 Martin Ebinger  51 Jens Schittenhelm  52 Stephan Frank  53 Rainer Grobholz  54 Istvan Vajtai  55 Volkmar Hans  56 Reinhard Schneppenheim  42 Karel Zitterbart  57 V Peter Collins  58 Eleonora Aronica  59 Pascale Varlet  60 Stephanie Puget  61 Christelle Dufour  62 Jacques Grill  62 Dominique Figarella-Branger  63 Marietta Wolter  64 Martin U Schuhmann  65 Tarek Shalaby  66 Michael Grotzer  66 Timothy van Meter  67 Camelia-Maria Monoranu  68 Jörg Felsberg  64 Guido Reifenberger  64 Matija Snuderl  69 Lynn Ann Forrester  70 Jan Koster  71 Rogier Versteeg  71 Richard Volckmann  71 Peter van Sluis  71 Stephan Wolf  72 Tom Mikkelsen  73 Amar Gajjar  74 Kenneth Aldape  75 Andrew S Moore  76 Michael D Taylor  14 Chris Jones  13 Nada Jabado  77 Matthias A Karajannis  78 Roland Eils  4   79   80 Matthias Schlesner  4 Peter Lichter  5   80 Andreas von Deimling  6   7 Stefan M Pfister  1   2 David W Ellison  3 Andrey Korshunov  6   7 Marcel Kool  1
Affiliations

New Brain Tumor Entities Emerge from Molecular Classification of CNS-PNETs

Dominik Sturm et al. Cell. .

Abstract

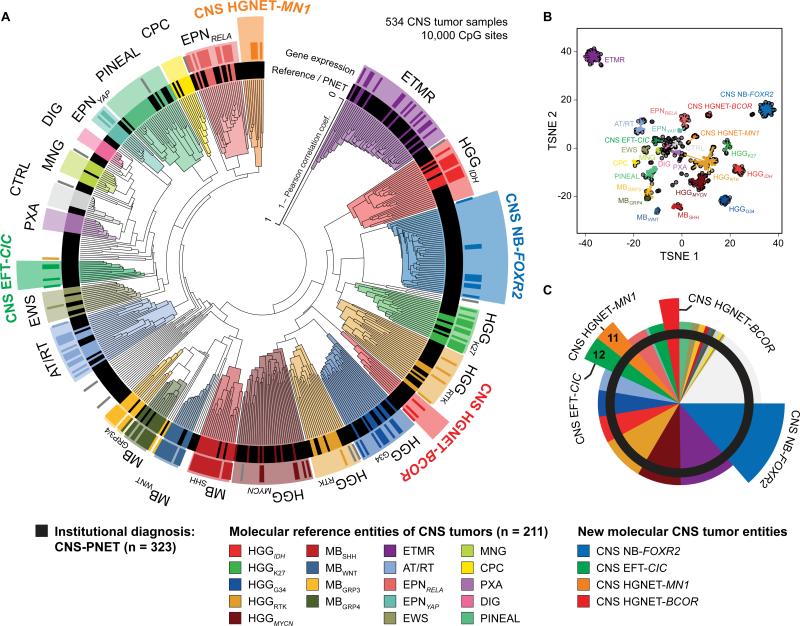
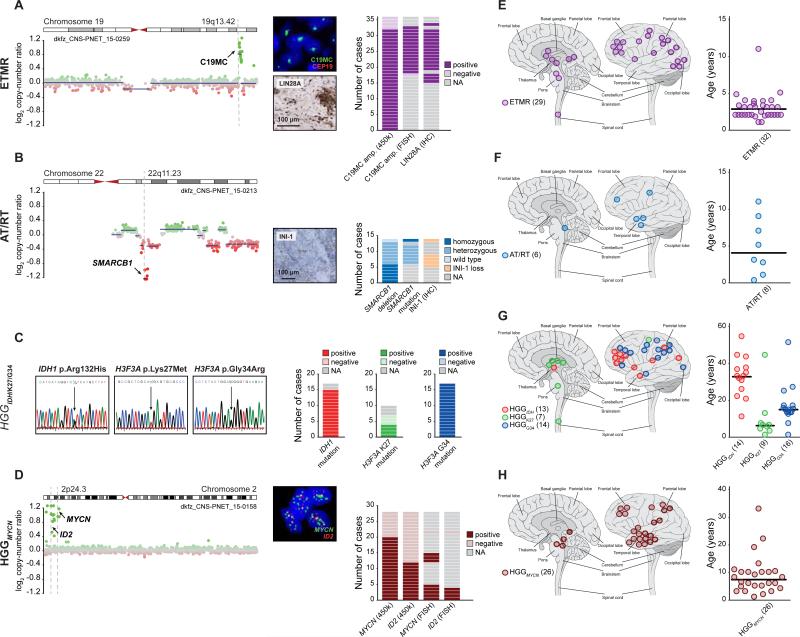
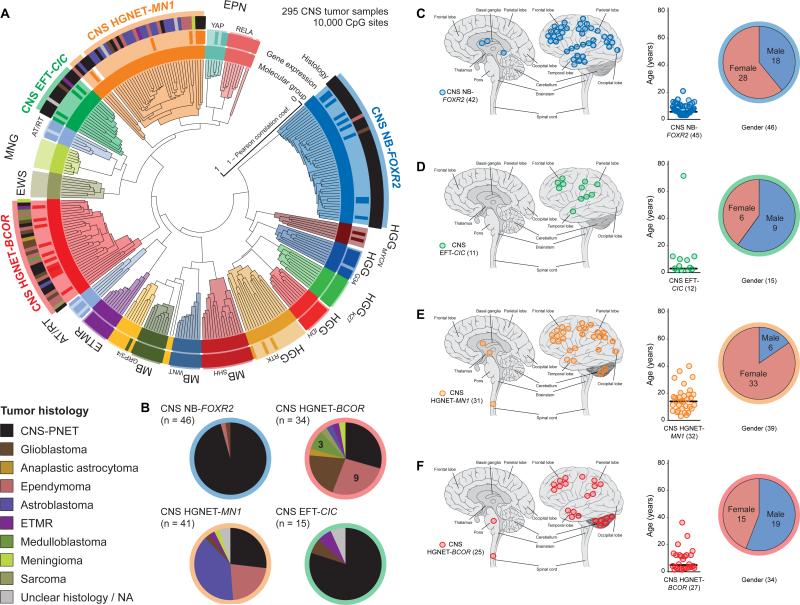
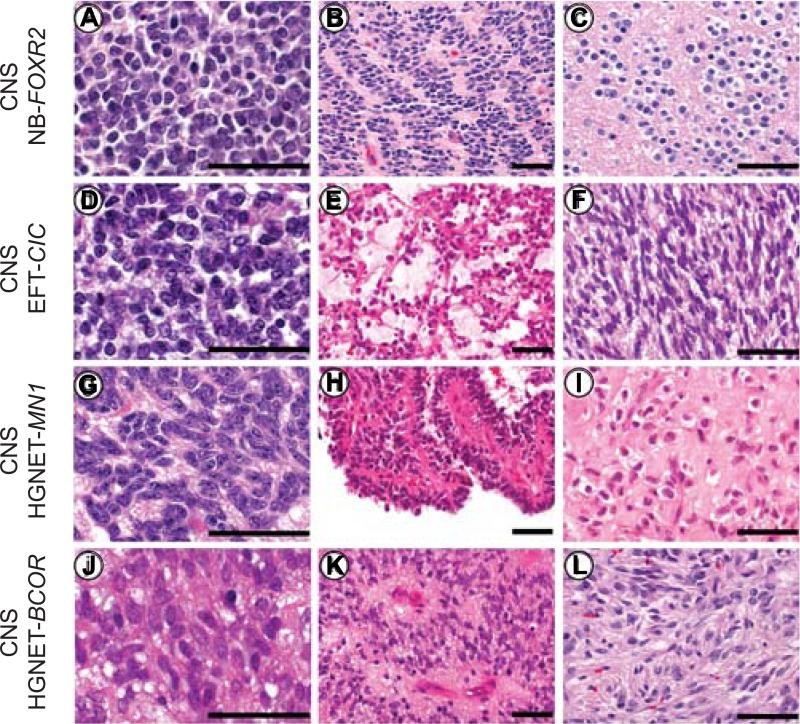
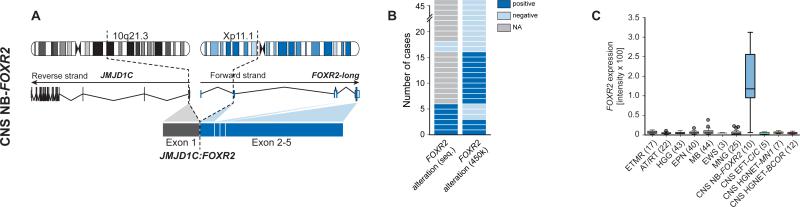
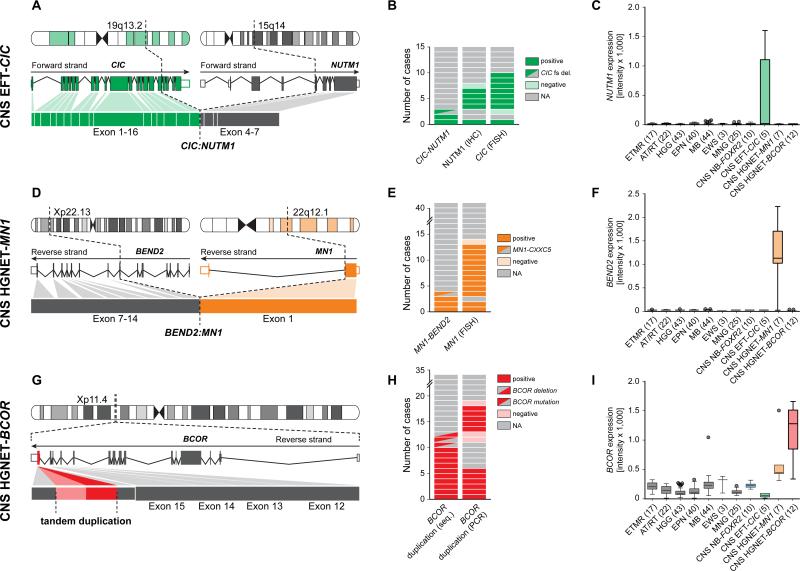
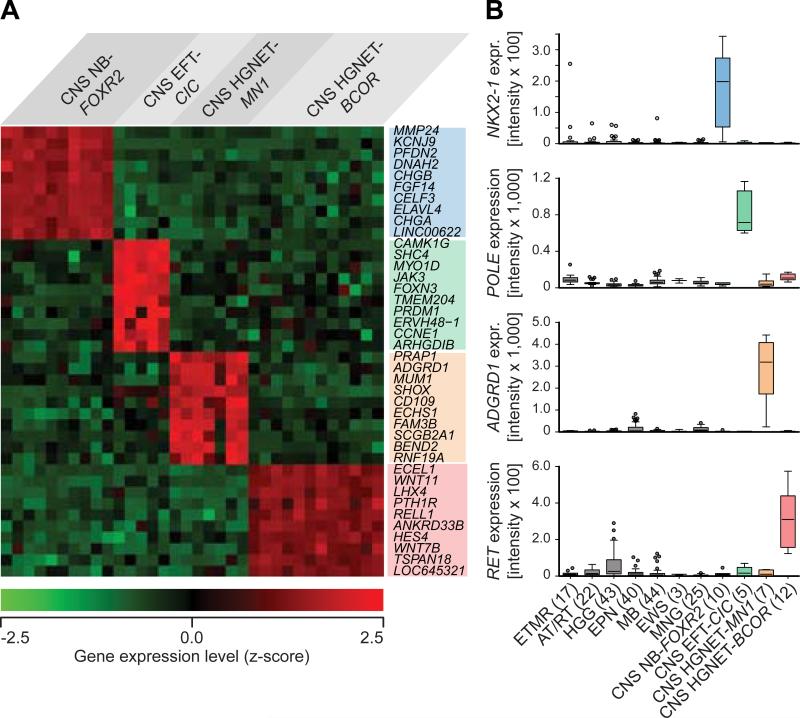
Primitive neuroectodermal tumors of the central nervous system (CNS-PNETs) are highly aggressive, poorly differentiated embryonal tumors occurring predominantly in young children but also affecting adolescents and adults. Herein, we demonstrate that a significant proportion of institutionally diagnosed CNS-PNETs display molecular profiles indistinguishable from those of various other well-defined CNS tumor entities, facilitating diagnosis and appropriate therapy for patients with these tumors. From the remaining fraction of CNS-PNETs, we identify four new CNS tumor entities, each associated with a recurrent genetic alteration and distinct histopathological and clinical features. These new molecular entities, designated "CNS neuroblastoma with FOXR2 activation (CNS NB-FOXR2)," "CNS Ewing sarcoma family tumor with CIC alteration (CNS EFT-CIC)," "CNS high-grade neuroepithelial tumor with MN1 alteration (CNS HGNET-MN1)," and "CNS high-grade neuroepithelial tumor with BCOR alteration (CNS HGNET-BCOR)," will enable meaningful clinical trials and the development of therapeutic strategies for patients affected by poorly differentiated CNS tumors.


Figures

Figure 1
Figure 1. Molecular Classification of CNS-PNETs by DNA Methylation Profiling
(A) Unsupervised clustering of DNA methylation patterns of 323 CNS-PNET samples alongside 211 reference samples representing CNS tumors of known histology and molecular subtype using the 10,000 most variably methylated probes. Molecular diagnostic reference tumors or CNS-PNETs (inner circle) and gene expression subgroup assignment (outer circle) are depicted by colored bars as indicated. DNA methylation clusters are highlighted by colors as indicated. Grey bars indicate samples unclassifiable by gene expression analyses. (B) Two dimensional representation of pairwise sample correlations using the 10,000 most variably methylated probes by t-Distributed Stochastic Neighbor Embedding (tSNE) dimensionality reduction. The same samples as in (A) are used (n = 534). Reference samples are colored according to their molecular reference entity. CNS-PNET samples are colored in black. Lines connect each sample to the centroid of its respective molecular CNS tumor entity. (C) Re-classification of 323 CNS-PNETs into known molecular reference entities and four new CNS tumor entities by molecular profiling. Entities correspond to DNA methylation clusters and are represented by colors as indicated. See also Figure S1 and Table S1.
Figure 2
Figure 2. Molecular and Clinical Characteristics of Re-Classified CNS-PNET Groups
(A-D) Molecular characteristics of CNS-PNETs from ETMR (A), AT/RT (B), HGGIDH, HGGK27, and HGGG34 (C), and HGGMYCN (D) DNA methylation clusters. Detection and frequency of characteristic molecular alterations in each group are indicated. Representative copy-number profiles in (A), (B), and (D) depict genomic gains (green dots) and losses (red dots) on individual chromosomes as indicated. FISH and IHC images in (A), (B), and (D) show representative tumor samples. (E-H) Tumor location and age at diagnosis from ETMR (E), AT/RT (F), HGGIDH, HGGK27, and HGGG34 (G), and HGGMYCN (H) DNA methylation clusters. Black bars in age plots indicate the median. Numbers in brackets indicate group size with available data. See also Figure S2 and Tables S1 and S2.
Figure 3
Figure 3. Identification of New CNS Tumor Entities Across Histologies
(A) Unsupervised clustering of DNA methylation patterns of 77 CNS-PNET samples alongside 159 reference samples and 59 additional samples representing CNS tumors of varying histology using the 10,000 most variably methylated probes. Molecular subgroup assignment by DNA methylation (inner circle) or gene expression patterns (middle circle) correspond to subgroup labels. Original tumor histology (outer circle) is depicted for tumors from new molecular CNS tumor entities by colored bars as indicated. (B) Composition of four new CNS tumor entities by histological diagnosis. Tumor histology is represented by colors as indicated. (C-F) Clinical patient information for four novel CNS tumor entities CNS NB-FOXR2 (C), CNS EFT-CIC (D), CNS HGNET-MN1 (E), and CNS HGNET-BCOR (F). For each entity, tumor location (left panel), age at diagnosis (middle panel), and gender distribution (right panel) are shown. Numbers in brackets indicate group size with available data. See also Figure S3 and Table S3.
Figure 4
Figure 4. Histopathological Patterns of New CNS Tumor Entities
(A-C) The CNS NB-FOXR2 entity was characterized by uniform round embryonal cells with minimal cytological pleomorphism. Nuclear palisades and neurocytic differentiation were frequently encountered. (D-F) CNS EFT-CIC tumors were composed of small monotonous cells. The tumor architecture was variable and included fascicular and alveolar growth. Select examples demonstrated a spindle cell phenotype. (G-I) CNS HGNET-MN1 tumors were composed of monotonous neuroepithelial cells with oval forms. Pseudopapillary architecture and dense stromal hyalinization was often encountered. (J-L) The CNS HGNET-BCOR entity was characterized by oval to elongated cells. Perivascular anuclear zones were often present and glial fibrillary processes were typical. Scale bars represent 50 μm. See also Figure S4 and Table S2.
Figure 5
Figure 5. Recurrent Molecular Alterations in the CNS NB-FOXR2 Entity
(A) Schematic representation depicting chromosomal location, wild-type RNA transcripts, and exon structures resulting from an exemplary genetic alteration affecting the FOXR2 gene. (B) Frequency of FOXR2 re-arrangements identified by RNA/DNA sequencing or copy-number data. (C) Gene expression levels of FOXR2 in various CNS tumor entities. See also Figure S5 and Table S4.
Figure 6
Figure 6. Recurrent Molecular Alterations in CNS EFT-CIC, CNS HGNET-MN1 and CNS HGNET-BCOR Entities
(A-I) Schematic representation, frequency, and transcriptomic effects of recurrent molecular alterations found in tumors from the CNS EFT-CIC (A-C), CNS HGNET-MN1 (D-F), and CNS HGNET-BCOR (G-I) entities. Schematics in (A), (D), and (G) depict chromosomal location, wild-type RNA transcripts, and exon structures resulting from recurrent alterations. Frequencies of the respective events detected by different methods are depicted in panels (B), (E), and (H). Gene expression levels of NUTM1, BEND2, and BCOR across various CNS tumor entities are displayed in panels (C), (F), and (I). See also Figure S6 and Table S4.
Figure 7
Figure 7. Transcriptional Profiling of New CNS Tumor Entities
(A) Heatmap representing the expression levels of the ten most significantly differentially up-regulated genes comparing one new CNS tumor entity vs. the three others. Each column represents one sample, each lane represents one gene. Gene expression levels are represented by a color scale as indicated. (B) Individually selected marker genes specifically up-regulated in one of the new CNS tumor entities compared with other CNS tumor entities as indicated. See also Figure S7 and Table S5 and S6.

Comment in

References

    1. Abhiman S, Iyer LM, Aravind L. BEN: a novel domain in chromatin factors and DNA viral proteins. Bioinformatics. 2008;24:458–461. - PMC - PubMed
    1. Buczkowicz P, Hoeman C, Rakopoulos P, Pajovic S, Letourneau L, Dzamba M, Morrison A, Lewis P, Bouffet E, Bartels U, et al. Genomic analysis of diffuse intrinsic pontine gliomas identifies three molecular subgroups and recurrent activating ACVR1 mutations. Nat Genet. 2014;46:451–456. - PMC - PubMed
    1. Buijs A, van Rompaey L, Molijn AC, Davis JN, Vertegaal AC, Potter MD, Adams C, van Baal S, Zwarthoff EC, Roussel MF, et al. The MN1-TEL fusion protein, encoded by the translocation (12;22)(p13;q11) in myeloid leukemia, is a transcription factor with transforming activity. Mol Cell Biol. 2000;20:9281–9293. - PMC - PubMed
    1. Capper D, Weissert S, Balss J, Habel A, Meyer J, Jager D, Ackermann U, Tessmer C, Korshunov A, Zentgraf H, et al. Characterization of R132H mutation-specific IDH1 antibody binding in brain tumors. Brain Pathol. 2010;20:245–254. - PMC - PubMed
    1. Chan KM, Fang D, Gan H, Hashizume R, Yu C, Schroeder M, Gupta N, Mueller S, James CD, Jenkins R, et al. The histone H3.3K27M mutation in pediatric glioma reprograms H3K27 methylation and gene expression. Genes Dev. 2013;27:985–990. - PMC - PubMed

Publication types

MeSH terms