. 2016;15(7):986-97.
doi: 10.1080/15384101.2016.1152425.

An integrative analysis of reprogramming in human isogenic system identified a clone selection criterion

Affiliations

An integrative analysis of reprogramming in human isogenic system identified a clone selection criterion

Maria V Shutova et al. Cell Cycle. 2016.

Abstract

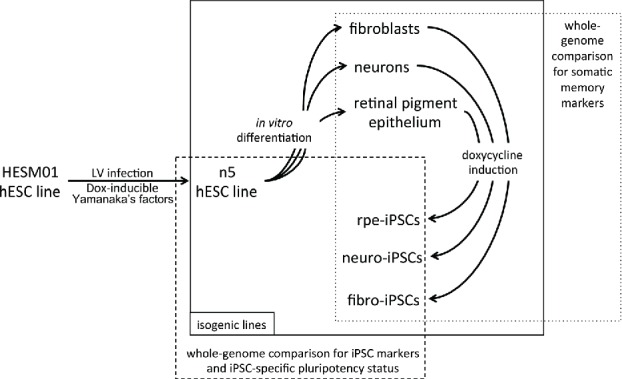
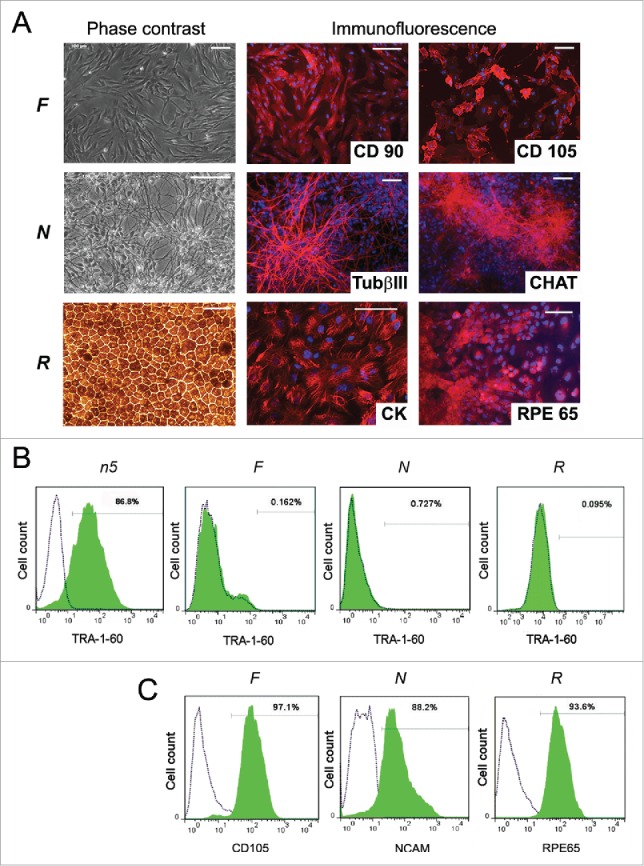
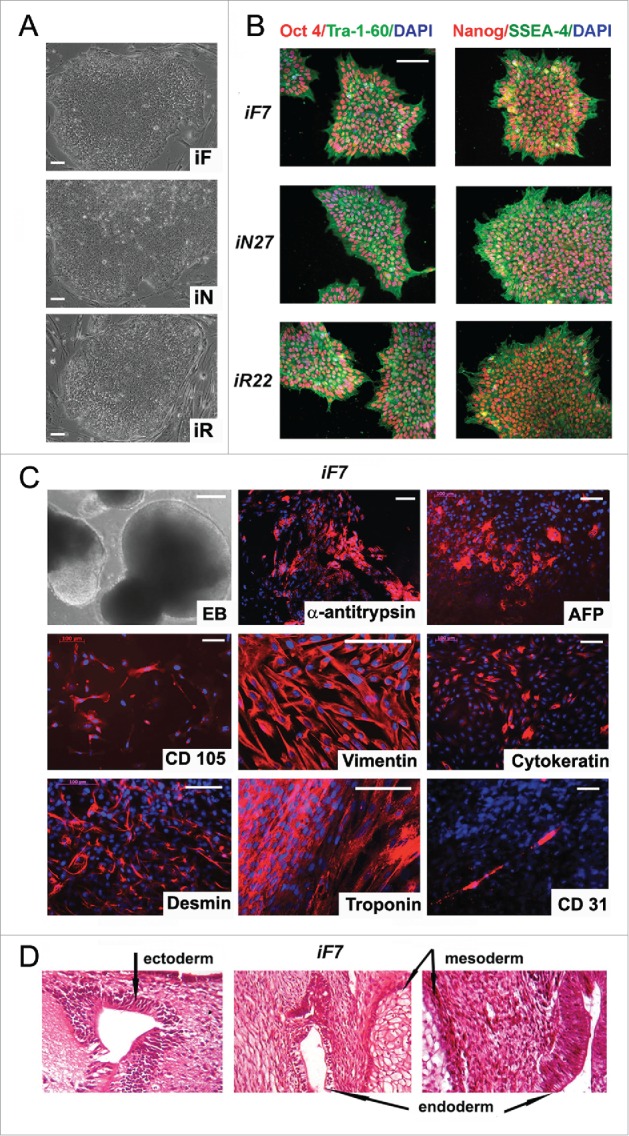
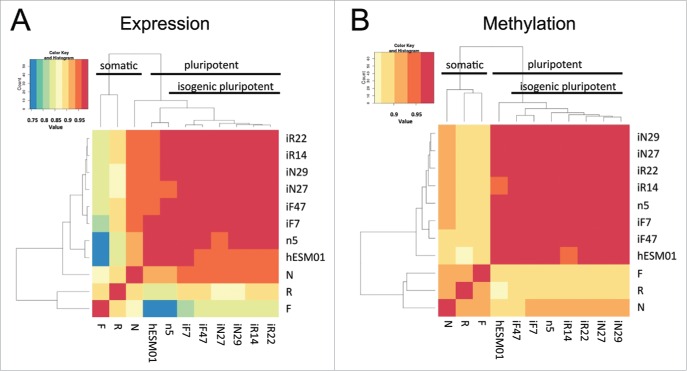
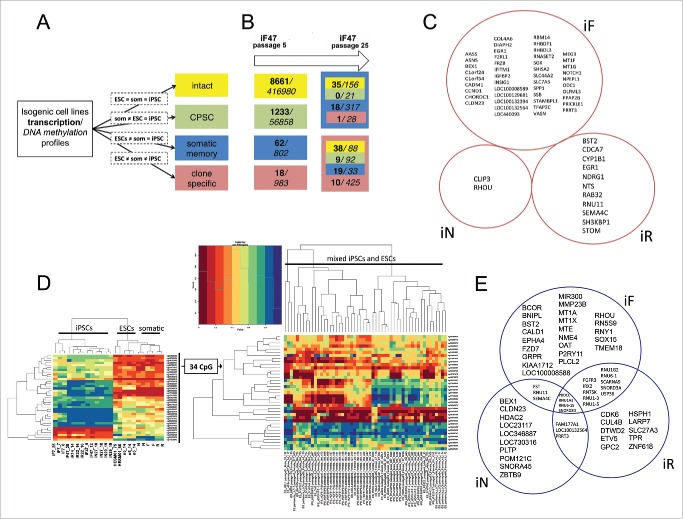
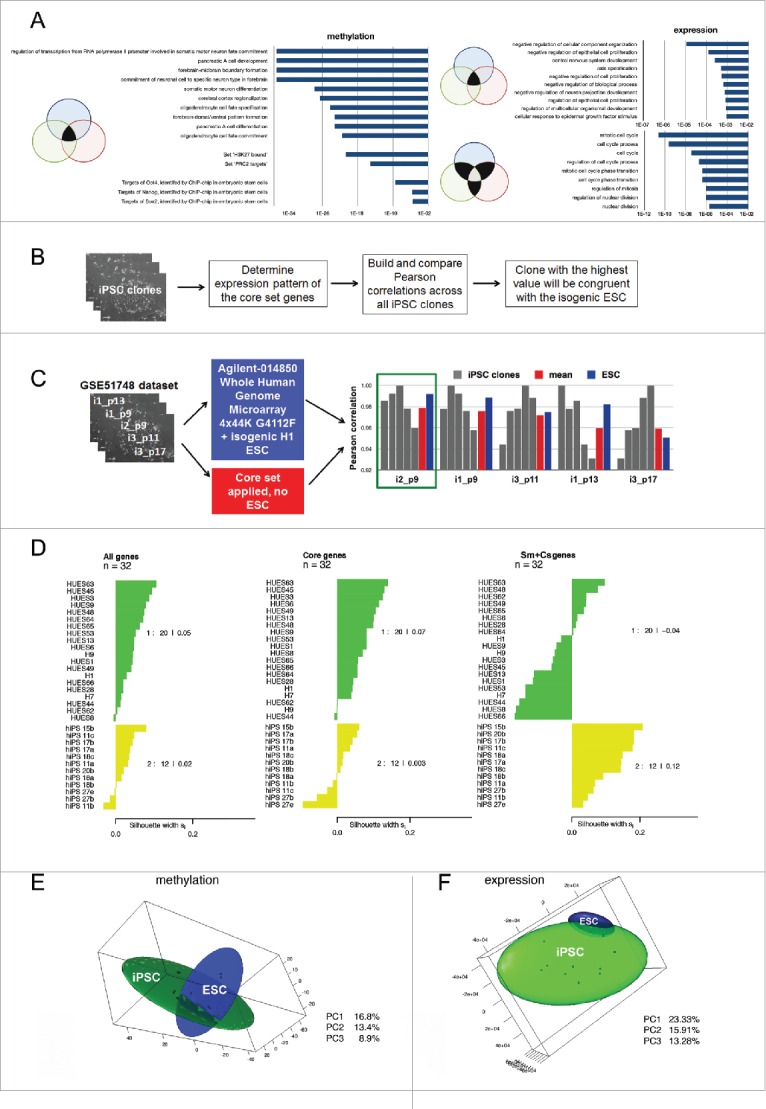
The pluripotency of newly developed human induced pluripotent stem cells (iPSCs) is usually characterized by physiological parameters; i.e., by their ability to maintain the undifferentiated state and to differentiate into derivatives of the 3 germ layers. Nevertheless, a molecular comparison of physiologically normal iPSCs to the "gold standard" of pluripotency, embryonic stem cells (ESCs), often reveals a set of genes with different expression and/or methylation patterns in iPSCs and ESCs. To evaluate the contribution of the reprogramming process, parental cell type, and fortuity in the signature of human iPSCs, we developed a complete isogenic reprogramming system. We performed a genome-wide comparison of the transcriptome and the methylome of human isogenic ESCs, 3 types of ESC-derived somatic cells (fibroblasts, retinal pigment epithelium and neural cells), and 3 pairs of iPSC lines derived from these somatic cells. Our analysis revealed a high input of stochasticity in the iPSC signature that does not retain specific traces of the parental cell type and reprogramming process. We showed that 5 iPSC clones are sufficient to find with 95% confidence at least one iPSC clone indistinguishable from their hypothetical isogenic ESC line. Additionally, on the basis of a small set of genes that are characteristic of all iPSC lines and isogenic ESCs, we formulated an approach of "the best iPSC line" selection and confirmed it on an independent dataset.

Keywords: DNA methylation; gene transcription; genome-wide analysis; human pluripotent stem cells; isogenic; reprogramming; somatic memory.


Figures

Figure 1.
Figure 1.
Schematic representation of the experimental procedure. Lentiviral vectors carrying reprogramming factors were introduced into the hESM01 cell line, and the stable clones were selected for further analysis (zero transgene expression, genome stability, in vitro and in vivo pluripotency). The resulting hESM01-OSKMN-DOX-n5 cell line was differentiated into 3 types of somatic cells. Magnetically separated cells were reprogrammed by DOX induction and iPSC clones generated from each cell type were chosen for genome-wide analysis of reprogramming traces, somatic memory, and iPSC specific markers using transcription and DNA methylation data.
Figure 2.
Figure 2.
Characterization of n5 somatic derivatives. (A) Morphology (phase contrast microscopy) and immunocytochemistry of fibroblast-like cells (F), neurons (N), and retinal pigment epithelial cells (R). TUBb3, β-tubulin (III); CHAT, choline acetyltransferase; CK, cytokeratin; RPE65, retinal pigment epithelium-specific 65 kDa protein. Signals corresponding to the respective markers are shown in red, with blue indicating nuclei stained with DAPI. Scale bar, 100 mM. (B) FACS analysis of TRA-1-60 expression in differentiated cells. Dotted lines represent isotype controls and antibody staining is shown in green. (C) FACS analysis of the purity of magnetically separated F, N, and R cells for corresponding somatic markers.
Figure 3.
Figure 3.
Characterization of isogenic iPSC lines reprogrammed from fibroblasts, neurons and RPE cells. (A) colony morphology of iF, iN, and iR cells; (B) immunocytochemical assay of iF, iN, and iR cells; for pluripotent markers (red and green indicate respective markers, blue indicates DAPI); (C) representative images of embryoid bodies and immunocytochemistry of in vitro iPSC-derived differentiated cell (red indicates markers, blue indicates DAPI) iF7 clones are shown. Scale bar, 100 mM; (D) Teratoma sections derived from the iF7 cell line, hematoxylin-eosin staining.
Figure 4.
Figure 4.
Genome-wide analysis of gene transcription and DNA methylation in the isogenic pluripotent and somatic cell lines. (A, B) Heatmaps based on Spearman correlations between all cell lines; the color scale ranges from 0.75 to 1. (A) Transcriptome and (B) methylome data (P < 0.01, FDR < 0.05).
Figure 5.
Figure 5.
Reprogramming process, somatic memory and stochastic event input analysis in an isogenic system of human PSCs. (A) Graphical representation of the approach to analyze gene expression and CpG methylation during differentiation and reprogramming (“=” – same level of expression or methylation between indicated groups, “som” – somatic cell lines). (B) Input of genes (bold) and CpGs (italic) that drifted from specified groups (same colors as in A) into the “clone-specific” (red background) and “somatic memory” (blue background) groups during iPSC passaging. The number of passages is shown on top. (C) Clone-specific genes of different isogenic iPSC lines. (D) The methylation of 34 clone-specific CpGs is a specific reprogramming signature for our isogenic cell lines. The heatmap on the left shows that the methylation level of 34 CpG sites distinguishes iPSCs from ESCs and somatic cell lines in our isogenic system. However, the same CpGs do not discriminate ESCs and iPSCs in the independent GSE31848 data set; heatmap on the right. (E) Somatic memory group genes were identified for each iPSC type separately; however, most of them are shared by different iPSCs.
Figure 6.
Figure 6.
The isogenic system provides a core genetic signature for reprogrammed cells. (A) Top 10 Gene Ontology Biological Processes and Transcription Factor Targets shared by at least 2 different iPSC lines; the corresponding p-values are shown in bars. (B) Suggested approach to select an iPSC clone identical to its isogenic ESCs using the core gene set expression profile. (C) Examination of the best clone selection approach using the GSE51748 dataset. Pearson correlations between a particular iPSC clone and other clones calculated on the basis of the core set gene expression levels are shown in gray; the mean correlation between them is shown in red; Pearson correlations between particular iPSC clones and isogenic ESC lines calculated on the basis of all transcriptome data are shown in blue. The green rectangle indicates the best clone that has the highest mean correlation with others using both approaches. (D) Silhouette values (Sv) indicate the similarity of 32 ESCs (green cluster) and iPSCs (yellow cluster) lines from GSE25970 data set. On the right side, the Svs for each cluster are shown. Sv values were calculated using the expression pattern of all genes in the GSE25970 dataset (“All genes”): expression level only of the core set of genes; (“Core set”): expression level of the genes belonging to somatic memory and clone specific groups (“Sm+Cs genes”). (E, F) PCA analysis of isogenic PSC lines established in our study based on (E) methylation and (F) expression data. In both cases, 3 PCs were used and 3-D maps were built. The green sphere shows the location of the iPSC cluster, while the blue sphere shows the ESC cluster.

References

    1. Thomson JA, Itskovitz-Eldor J, Shapiro SS, Waknitz MA, Swiergiel JJ, Marshall VS, Jones JM. Embryonic stem cell lines derived from human blastocysts. Science 1998; 282:1145-7; PMID:9804556; http://dx.doi.org/10.1126/science.282.5391.1145 - DOI - PubMed
    1. Pan CK, Heilweil G, Lanza R, Schwartz SD. Embryonic stem cells as a treatment for macular degeneration. Expert Opin Biol Ther 2013; 13:1125-33; PMID:23705996; http://dx.doi.org/10.1517/14712598.2013.793304 - DOI - PubMed
    1. Schwartz SD, Hubschman J-P, Heilwell G, Franco-Cardenas V, Pan CK, Ostrick RM, Mickunas E, Gay R, Klimanskaya I, Lanza R. Embryonic stem cell trials for macular degeneration: a preliminary report. Lancet 2012; 379:713-20; PMID:22281388; http://dx.doi.org/10.1016/S0140-6736(12)60028-2 - DOI - PubMed
    1. Bock C, Kiskinis E, Verstappen G, Gu H, Boulting G, Smith ZD, Ziller M, Croft GF, Amoroso MW, Oakley DH, et al.. Reference Maps of human ES and iPS cell variation enable high-throughput characterization of pluripotent cell lines. Cell 2011; 144:439-52; PMID:21295703; http://dx.doi.org/10.1016/j.cell.2010.12.032 - DOI - PMC - PubMed
    1. Marchetto MCN, Yeo GW, Kainohana O, Marsala M, Gage FH, Muotri AR. Transcriptional signature and memory retention of human-induced pluripotent stem cells. PLoS One 2009; 4:e7076; PMID:19763270; http://dx.doi.org/10.1371/journal.pone.0007076 - DOI - PMC - PubMed

Publication types