. 2016 Feb 26;10(2):e0004490.
doi: 10.1371/journal.pntd.0004490. eCollection 2016 Feb.

Changes in Proteome Profile of Peripheral Blood Mononuclear Cells in Chronic Chagas Disease

Affiliations

Changes in Proteome Profile of Peripheral Blood Mononuclear Cells in Chronic Chagas Disease

Nisha Jain Garg et al. PLoS Negl Trop Dis. .

Abstract

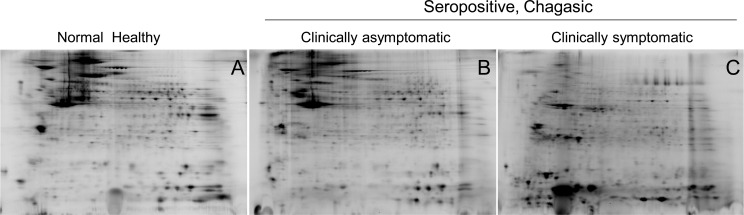
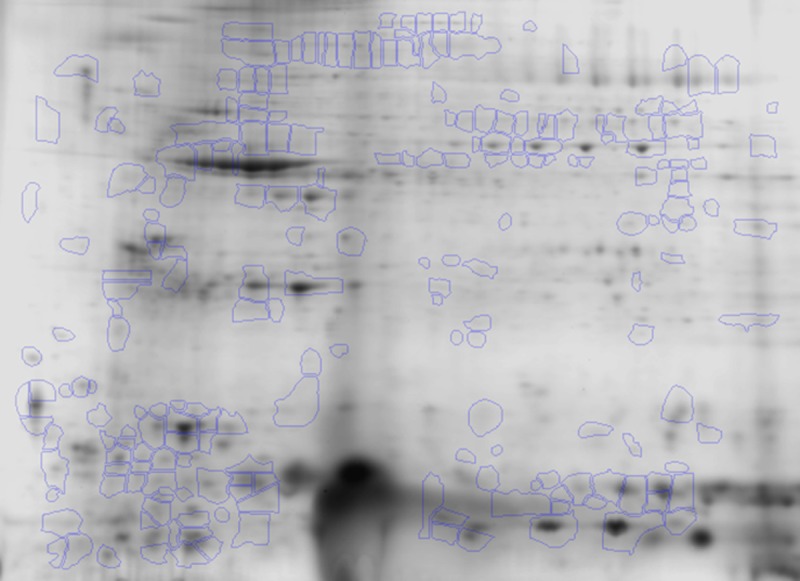
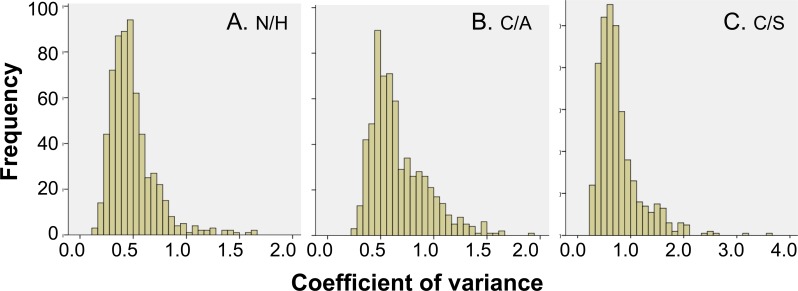
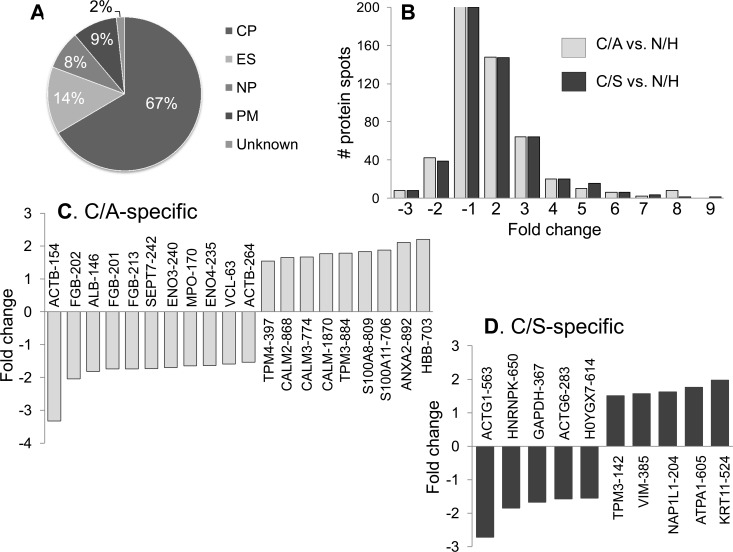
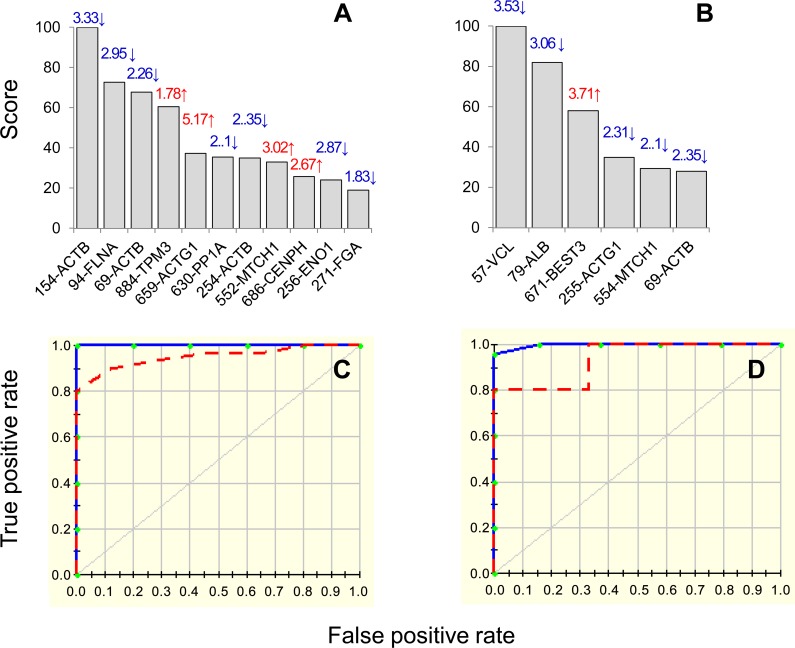
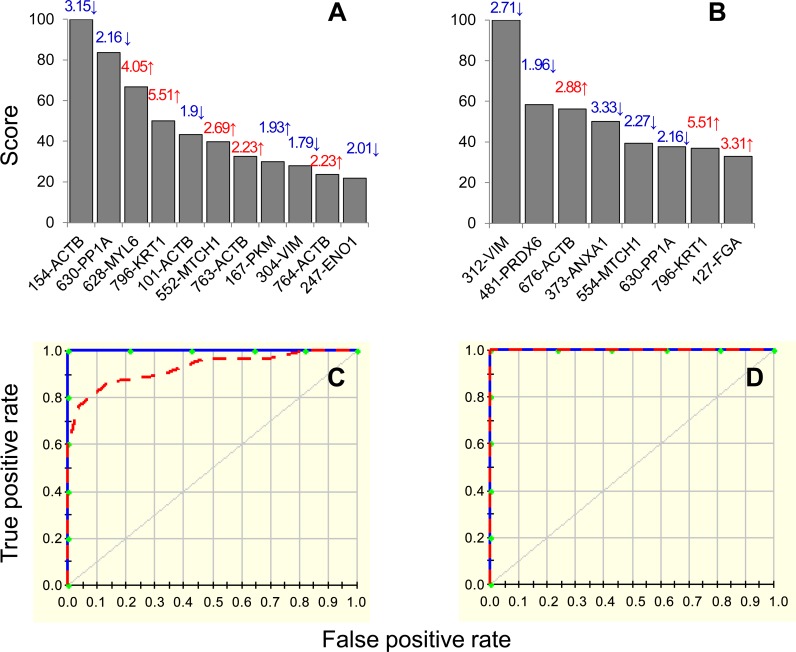
Trypanosoma cruzi (Tc) infection causes chagasic cardiomyopathy; however, why 30-40% of the patients develop clinical disease is not known. To discover the pathomechanisms in disease progression, we obtained the proteome signature of peripheral blood mononuclear cells (PBMCs) of normal healthy controls (N/H, n = 30) and subjects that were seropositive for Tc-specific antibodies, but were clinically asymptomatic (C/A, n = 25) or clinically symptomatic (C/S, n = 28) with cardiac involvement and left ventricular dysfunction. Protein samples were labeled with BODIPY FL-maleimide (dynamic range: > 4 orders of magnitude, detection limit: 5 f-mol) and resolved by two-dimensional gel electrophoresis (2D-GE). After normalizing the gel images, protein spots that exhibited differential abundance in any of the two groups were analyzed by mass spectrometry, and searched against UniProt human database for protein identification. We found 213 and 199 protein spots (fold change: |≥ 1.5|, p< 0.05) were differentially abundant in C/A and C/S individuals, respectively, with respect to N/H controls. Ingenuity Pathway Analysis (IPA) of PBMCs proteome dataset identified an increase in disorganization of cytoskeletal assembly and recruitment/activation and migration of immune cells in all chagasic subjects, though the invasion capacity of cells was decreased in C/S individuals. IPA predicted with high probability a decline in cell survival and free radical scavenging capacity in C/S (but not C/A) subjects. The MYC/SP1 transcription factors that regulate hypoxia and oxidative/inflammatory stress were predicted to be key targets in the context of control of Chagas disease severity. Further, MARS-modeling identified a panel of proteins that had >93% prediction success in classifying infected individuals with no disease and those with cardiac involvement and LV dysfunction. In conclusion, we have identified molecular pathways and a panel of proteins that could aid in detecting seropositive individuals at risk of developing cardiomyopathy.


Conflict of interest statement

The authors have declared that no competing interests exist.

Figures

Fig 1
Fig 1. Two-dimensional gel images of protein spots in PBMCs of chagasic patients and healthy controls.
PBMCs from seropositive chagasic subjects categorized as clinically asymptomatic (C/A, n = 25) and clinically symptomatic (C/S, n = 28), and normal healthy (N/H, n = 30) controls were reduced in presence of ascorbate, and labeled with BODIPY FL N- (2-aminoethyl) maleimide that covalently labels cysteine residues. The BD-labeled protein samples were separated in the 1st-dimension by isoelectric focusing on 11 cm linear pH 4–7 immobilized pH gradient strips, and in the 2nd-dimension by sodium dodecyl sulfate polyacrylamide gel electrophoresis (SDS-PAGE) on an 8–16% gradient gel. Gel images were obtained at 100 μm resolution using the Typhoon Trio Variable Mode Imager (GE Healthcare) to quantify BD-labeled proteins (Ex488 nm / Em520±15 nm). Shown are representative gel images of PBMCs from N/H (A), C/A (B) and C/S (C) subjects.
Fig 2
Fig 2. Identification of differentially abundant protein spots in chagasic PBMCs.
Of all the protein spots identified by 2-dimension electrophoresis, ratiometric calculation from BODIPY-fluorescence units in Asc+ aliquots (normal versus experimental) was conducted for quantifying differential abundance of proteins (Δ protein abundance = Asc+chagasic/Asc+ controls). The fold-change in protein spots in all gels were log transformed and submitted to statistical analysis as described in Materials and Methods. Protein spots that exhibited significant change in abundance in chagasic groups with respect to controls (p<0.05) are marked, and were submitted to MALDI-TOF MS analysis for protein identification (listed in Table 2).
Fig 3
Fig 3. Distribution of variation in abundance of protein spots.
Shown are distribution of coefficient of variation (CoV) values of the standard abundance values for each protein spot identified in PBMCs of N/H controls (30 gels, panel A) and C/A (25 gels, panel B) and C/S (28 gels, panel C) subjects.
Fig 4
Fig 4. Disease specific proteome signature in chagasic subjects.
(A) Ontological classification of differentially regulated proteins in terms of cellular localization was performed by Ingenuity Pathway Analysis. The compositions of the protein categories are presented as percentages of all individually identified proteins. (B) Shown are the frequency of protein spots that were changed in abundance in clinically-asymptomatic (C/A) and clinically-asymptomatic (C/S) chagasic subjects with respect to normal/healthy (N/H) controls (p<0.05). (C&D) Bar graphs show the protein molecules that were uniquely changed in abundance in C/A (C) and C/S (D) subjects. Data are plotted as fold change in comparison to N/H controls.
Fig 5
Fig 5. MARS model for classification of seropositive/chagasic subjects.
Input to the model were protein spots that were differentially expressed at p<0.001 (with B-H correction) in seropositive, clinically asymptomatic (84 spots, n = 25) subjects with respect to normal/healthy controls (n = 30). We employed 10-fold cross-validation (A&C) and 80% testing / 20% training (C&D) approaches to assess the fit of the model for testing dataset. Shown are the protein spots identified with high ranking (score >20) by cross-validation (A) and 80/20 (B) approaches for creating the MARS model for classifying C/A subjects from N/H controls. Protein spots in panels A&B are identified as spot #-protein name, and fold change (increase ↑, red; decrease ↓, blue) are plotted on each bar. The ROC curves show the prediction success of the cross-validation (C) and 80/20 models (D). Blue curves: training data ((AUC/ROC: 1.00), red curve: testing data (AUC/ROC: 0.96 for CV and 0.933 for 80/20).
Fig 6
Fig 6. MARS model for classification of chagasic subjects exhibiting clinical disease.
Input to the model were protein spots that were differentially expressed at p<0.001 (with B-H correction) in clinically symptomatic (C/S) chagasic subjects (87 spots, n = 25) in comparison to normal/healthy (N/H) controls (n = 30). We employed 10-fold cross-validation (A&C) and 80% testing / 20% training (C&D) approaches to assess the fit of the model for testing dataset. Shown are the protein spots identified with high ranking (score >20) by cross-validation (A) and 80/20 (B) approaches for creating the MARS model for classifying C/S subjects from N/H subjects. Protein spots in panels A&B are identified as spot #-protein name and fold change (increase ↑, red; decrease ↓, blue) are plotted on each bar. The ROC curves show the prediction success of the cross-validation (C) and 80/20 models (D). Blue curves: training data ((AUC/ROC: 1.00), red curve: testing data (AUC/ROC: 0.926 for CV and 1.0 for 80/20).

Similar articles

Cited by

References

    1. World Health Organization (2010) Chagas disease: control and elimination UNDP/World Bank/WHO, http://apps.who.int/gb/ebwha/pdf_files/WHA63/A63_17-en.pdf, accessed on Jan 15, 2016.
    1. Cardinal MV, Lauricella MA, Marcet PL, Orozco MM, Kitron U, et al. (2007) Impact of community-based vector control on house infestation and Trypanosoma cruzi infection in Triatoma infestans, dogs and cats in the Argentine Chaco. Acta Trop 103: 201–211. - PMC - PubMed
    1. de Assis GF, Azeredo BV, Carbajal de la Fuente AL, Diotaiuti L, de Lana M (2007) Domiciliation of Triatoma pseudomaculata (Correa e Espinola 1964) in the Jequitinhonha Valley, State of Minas Gerais. Rev Soc Bras Med Trop 40: 391–396. - PubMed
    1. Weinberg M, Waterman S, Lucas CA, Falcon VC, Morales PK, et al. (2003) The U.S.-Mexico borderinfectious disease surveillance project: establishing bi-national border surveillance. Emerg Infect Dis 9: 97–102. - PMC - PubMed
    1. Garraud O, Andreu G, Elghouzzi MH, Laperche S, Lefrere JJ (2007) Measures to prevent transfusion-associated protozoal infections in non-endemic countries. Travel Med Infect Dis 5: 110–112. - PubMed

Publication types

MeSH terms

LinkOut - more resources