. 2016 Feb 26;11(2):e0149564.
doi: 10.1371/journal.pone.0149564. eCollection 2016.

Characterization of the Gut Microbial Community of Obese Patients Following a Weight-Loss Intervention Using Whole Metagenome Shotgun Sequencing

Affiliations

Characterization of the Gut Microbial Community of Obese Patients Following a Weight-Loss Intervention Using Whole Metagenome Shotgun Sequencing

Sandrine Louis et al. PLoS One. .

Abstract

Background/objectives: Cross-sectional studies suggested that obesity is promoted by the gut microbiota. However, longitudinal data on taxonomic and functional changes in the gut microbiota of obese patients are scarce. The aim of this work is to study microbiota changes in the course of weight loss therapy and the following year in obese individuals with or without co-morbidities, and to asses a possible predictive value of the gut microbiota with regard to weight loss maintenance.

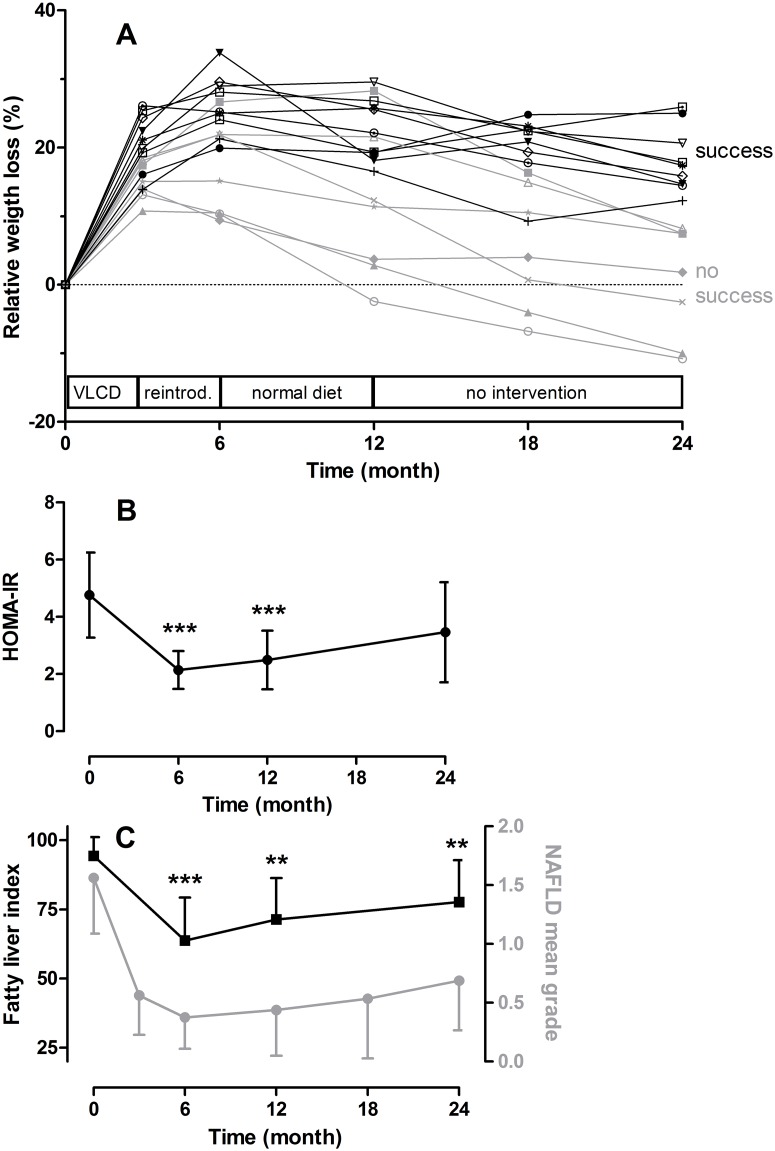
Subjects/methods: Sixteen adult patients, who followed a 52-week weight-loss program comprising low calorie diet, exercise and behavioral therapy, were selected according to their weight-loss course. Over two years, anthropometric and metabolic parameters were assessed and microbiota from stool samples was functionally and taxonomically analyzed using DNA shotgun sequencing.

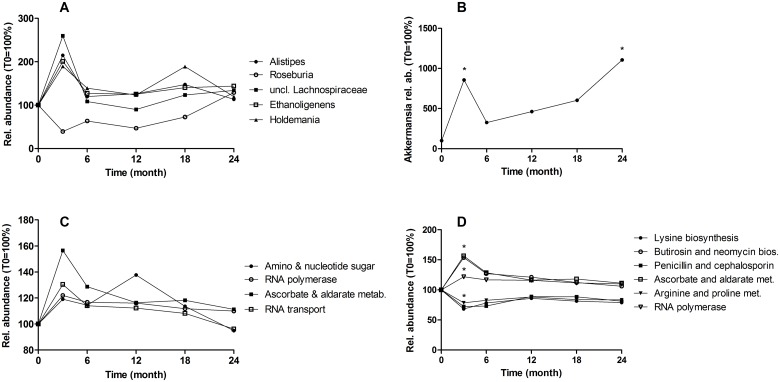
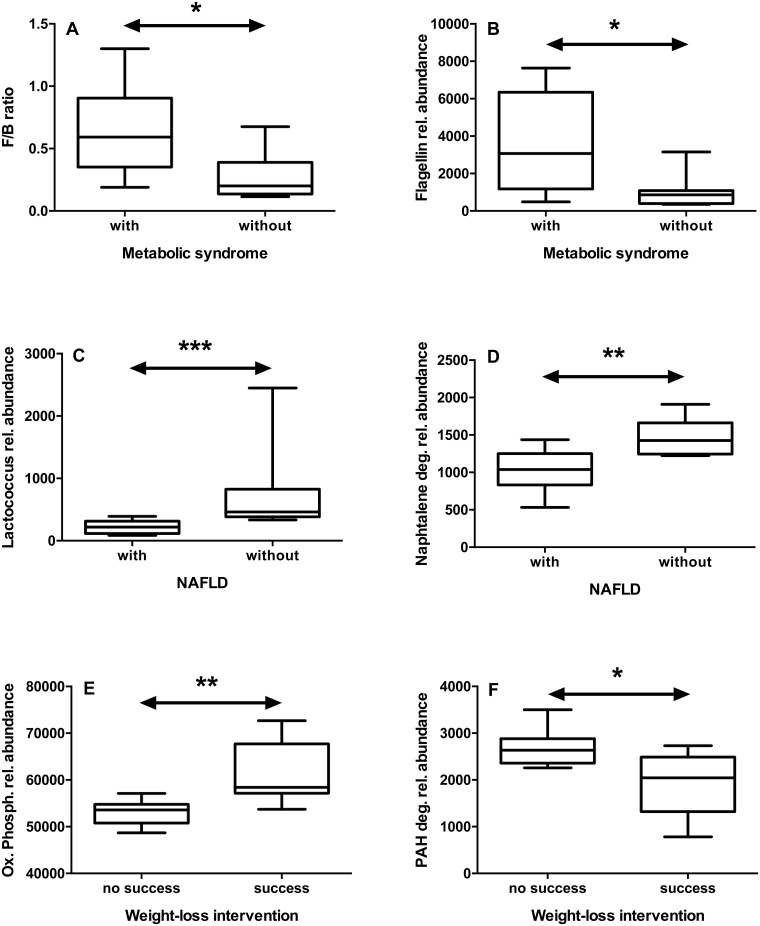
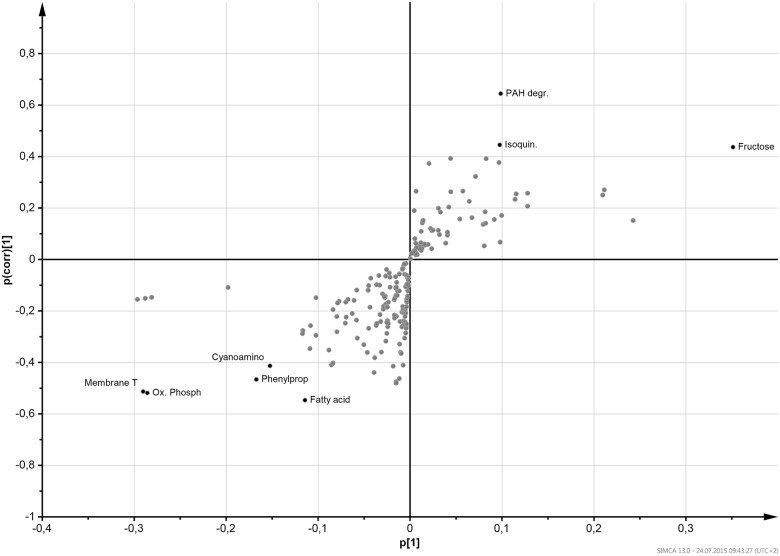
Results: Overall the microbiota responded to the dietetic and lifestyle intervention but tended to return to the initial situation both at the taxonomical and functional level at the end of the intervention after one year, except for an increase in Akkermansia abundance which remained stable over two years (12.7x10³ counts, 95%CI: 322-25100 at month 0; 141x103 counts, 95%CI: 49-233x103 at month 24; p = 0.005). The Firmicutes/Bacteroidetes ratio was higher in obese subjects with metabolic syndrome (0.64, 95%CI: 0.34-0.95) than in the "healthy obese" (0.27, 95%CI: 0.08-0.45, p = 0.04). Participants, who succeeded in losing their weight consistently over the two years, had at baseline a microbiota enriched in Alistipes, Pseudoflavonifractor and enzymes of the oxidative phosphorylation pathway compared to patients who were less successful in weight reduction.

Conclusions: Successful weight reduction in the obese is accompanied with increased Akkermansia numbers in feces. Metabolic co-morbidities are associated with a higher Firmicutes/Bacteroidetes ratio. Most interestingly, microbiota differences might allow discrimination between successful and unsuccessful weight loss prior to intervention.


Conflict of interest statement

Competing Interests: The authors have declared that no competing interests exist.

Figures

Fig 1
Fig 1. Clinical parameters of the study population.
A. Relative weight loss during the observation period of two years consisting of one year intervention program with very low calorie diet (VLCD) during the first 3 months, reintroduction of normal food (reintrod.) during month 3–6, and weight maintenance therapy under normal diet during month 7–12, followed by a one-year-observation without intervention. Each line represents a patient (n = 16). Patients were grouped into those with persistent success (PS group, >10% RWL at T24, black lines and symbols) or no persistent success (NS group, <10% RWL at T24, grey lines and symbols). B. Change of insulin resistance during time. Insulin resistance was assessed using the HOMA-IR as described in Subjects and Methods. C. Change of liver steatosis assessed by sonography (circles) and fatty liver index (squares). Data in B and C are indicated as means +/- 95% confidence intervals (n = 16), **P<0.01 and ***P<0.001 (as compared to baseline, Wilcoxon’s test).
Fig 2
Fig 2. Abundance change of genera and metabolic pathways during the study.
A. Relative abundance of five genera, which were the most abundant among those that changed during time. B. Akkermansia abundance. C. Relative abundance of all KEGG pathways that changed during whole study. D. Metabolic pathways that changed from baseline to T3. Abbreviations: bios, biosynthesis; met, metabolism. Statistics: Relative abundances are expressed in percent (abundance at T0 is 100%). Each dot is the mean at a given time point. Relative abundances at different time points were compared using the Friedman test (A, C: over the six time points), or the Wilcoxon test (B, D, *p < 0.05: between baseline and T3 or T24).
Fig 3
Fig 3. Bacterial species changes during weight loss intervention.
Cladogram (based on 16S sequences) displaying the most abundant species from genera influenced by the intervention. Significant changes between T0 and T3 (left column of squares), between T3 and T6 (middle column), and between T6 and T24 (right column) are indicated by a star(p < 0.05). Blue squares indicate a decrease, red an increase in abundance. Species are colored according to the phyla they belong to (blue: Spirochaetae, pink: Bacteroidetes, green: Firmicutes, light pink: Proteobacteria, orange: Actinobacteria, brown: Verrucomicrobia, red: Synergistetes). This tree was created using the free software EvolView [27].
Fig 4
Fig 4. Differences in gut microbiota between patients with different co-morbidities or different outcomes.
We compared patients with or without metabolic syndrome (A, B), with or without non-alcoholic fatty liver disease (NAFLD, panels C, D), and with or without persistent success in weight loss (E, F). In patients with metabolic syndrome, the Firmicutes/Bacteroidetes (F/B) ratio (A) and the flagellin gene (KEGG K02406) abundance (B) were increased at T0. In patients with NAFLD, the abundance of Lactococcus (C) and “naphthalene degradation” pathway (D) were decreased at T24. In patients with persistent success in weight loss, the abundance of the “oxidative phosphorylation” pathway was increased (E), whereas the “PAH degradation” pathway was decreased (F) at T0. Statistics: *p<0.05; **p<0.01, ***p<0.001 (Mann-Whitney’s test).
Fig 5
Fig 5. S-plot of the OPLS-DA model showing pathways associated with sustained weight loss over the whole study period.
Each pathway is displayed as a dot. Dots located in the top-right corner of the figure are potential markers for non-persistent weight loss, whereas those located in the bottom-left corner are associated with sustained weight loss. On the x-axis, the loading (p|1|) is indicated, which is a measure for the influence of the variable on the model. On the y-axis, the p(corr)|1| is indicated, which is a measure of the reliability of a variable as a marker. The strongest marker (defined as |p| > 0.09 and |p(corr)| > 0.4) are labeled and displayed in black color, the other pathways are displayed without labels in grey. Abbreviations: Fructose, “fructose and mannose metabolism”; Isoquin., “isoquinoline alkaloid biosynthesis”; PAH degr.,”polycyclic aromatic hydrocarbon degradation”; Fatty acid, “fatty acid metabolism”; Phenylprop, “phenylpropanoid biosynthesis”, Cyanoamino, “cyanoamino acid metabolism”; Membrane T, “membrane transport”, Ox. Phosph, “oxidative phosphorylation” pathway. Statistics: The model is based on the following characteristics: 1+2 components, R2X = 0.53, R2Y = 0.496, Q2 = 0.277, pcv-ANOVA = 1.73x10⁻⁴. Because of low Q2, permutations of the data were performed before running again the OPLS-DA. This lead each time to the same model.

References

    1. Despres J, Lemieux I. Abdominal obesity and metabolic syndrome. Nature 2006; 444: 881–887. - PubMed
    1. Backhed F, Ding H, Wang T, Hooper LV, Koh GY, Nagy A, et al. The gut microbiota as an environmental factor that regulates fat storage. Proc Natl Acad Sci U S A 2004; 101: 15718–15723. - PMC - PubMed
    1. Ley RE, Backhed F, Turnbaugh P, Lozupone CA, Knight RD, Gordon JI. Obesity alters gut microbial ecology. Proc Natl Acad Sci U S A 2005; 102: 11070–11075. - PMC - PubMed
    1. Ley RE, Turnbaugh PJ, Klein S, Gordon JI. Microbial ecology: human gut microbes associated with obesity. Nature 2006; 444: 1022–1023. - PubMed
    1. Turnbaugh PJ, Ley RE, Mahowald MA, Magrini V, Mardis ER, Gordon JI. An obesity-associated gut microbiome with increased capacity for energy harvest. Nature 2006; 444: 1027–1031. - PubMed