. 2016 Feb 27:17:144.
doi: 10.1186/s12864-016-2443-6.

Exploiting biological priors and sequence variants enhances QTL discovery and genomic prediction of complex traits

Affiliations

Exploiting biological priors and sequence variants enhances QTL discovery and genomic prediction of complex traits

I M MacLeod et al. BMC Genomics. .

Abstract

Background: Dense SNP genotypes are often combined with complex trait phenotypes to map causal variants, study genetic architecture and provide genomic predictions for individuals with genotypes but no phenotype. A single method of analysis that jointly fits all genotypes in a Bayesian mixture model (BayesR) has been shown to competitively address all 3 purposes simultaneously. However, BayesR and other similar methods ignore prior biological knowledge and assume all genotypes are equally likely to affect the trait. While this assumption is reasonable for SNP array genotypes, it is less sensible if genotypes are whole-genome sequence variants which should include causal variants.

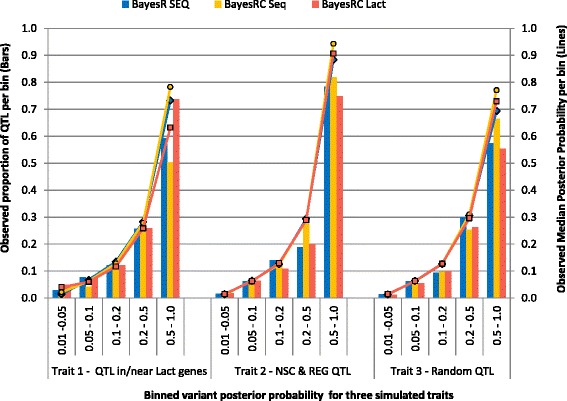
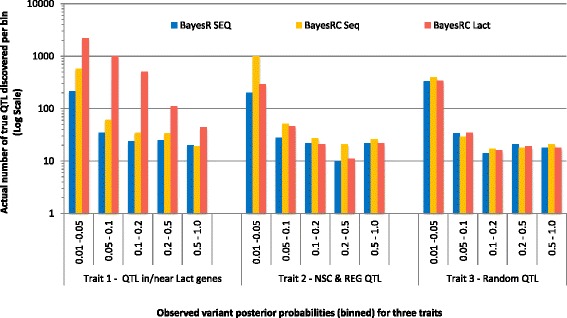
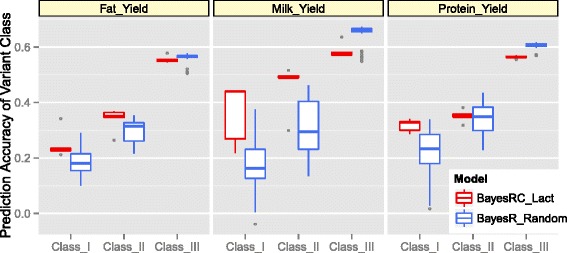
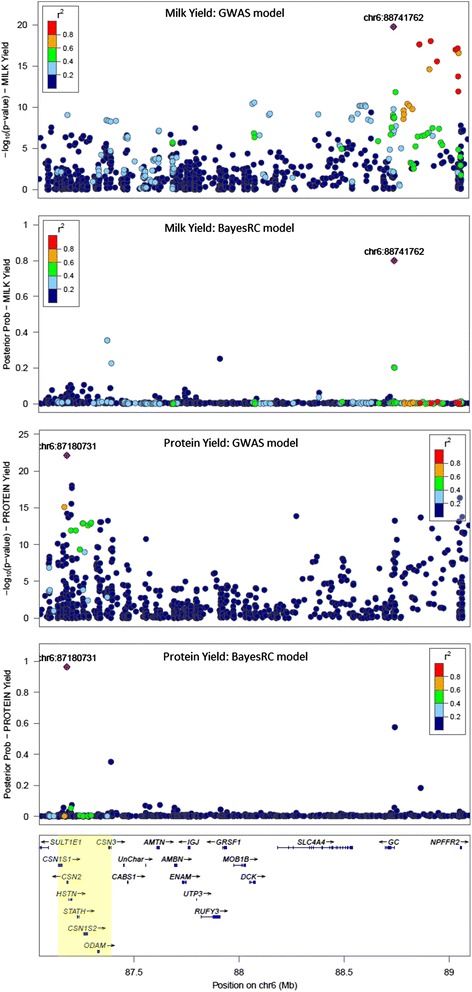
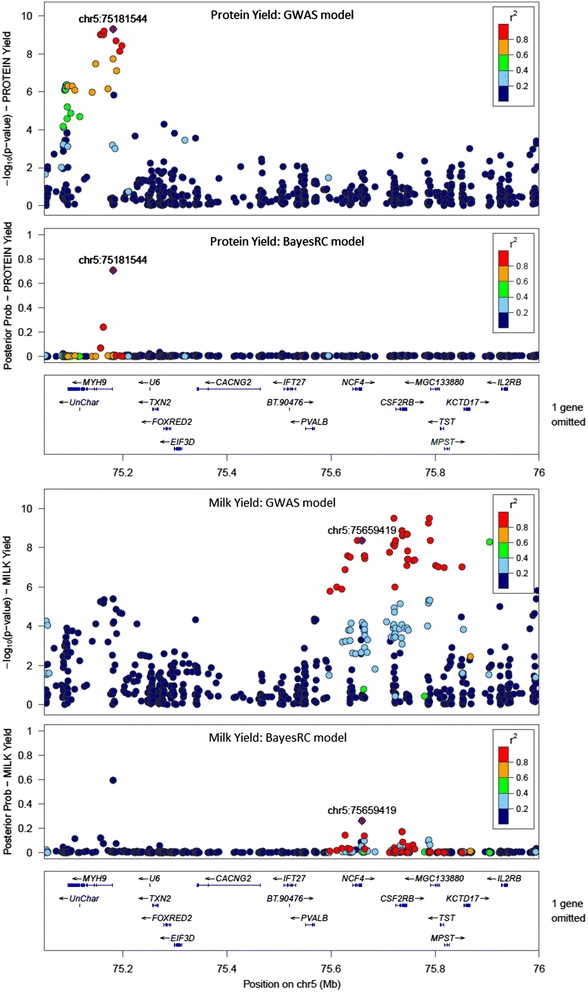
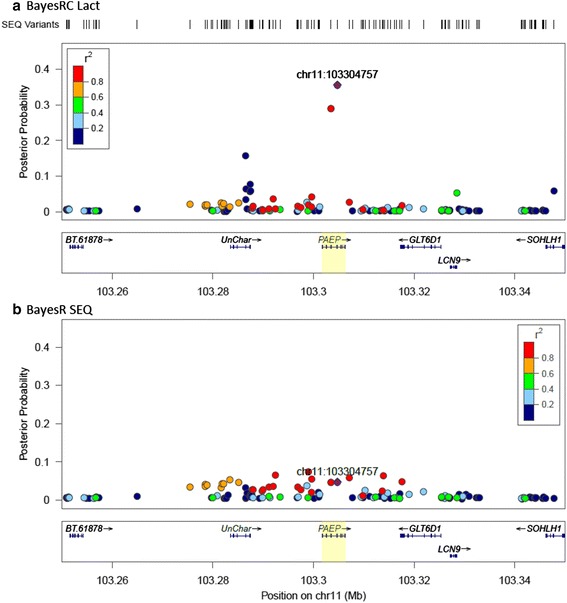
Results: We introduce a new method (BayesRC) based on BayesR that incorporates prior biological information in the analysis by defining classes of variants likely to be enriched for causal mutations. The information can be derived from a range of sources, including variant annotation, candidate gene lists and known causal variants. This information is then incorporated objectively in the analysis based on evidence of enrichment in the data. We demonstrate the increased power of BayesRC compared to BayesR using real dairy cattle genotypes with simulated phenotypes. The genotypes were imputed whole-genome sequence variants in coding regions combined with dense SNP markers. BayesRC increased the power to detect causal variants and increased the accuracy of genomic prediction. The relative improvement for genomic prediction was most apparent in validation populations that were not closely related to the reference population. We also applied BayesRC to real milk production phenotypes in dairy cattle using independent biological priors from gene expression analyses. Although current biological knowledge of which genes and variants affect milk production is still very incomplete, our results suggest that the new BayesRC method was equal to or more powerful than BayesR for detecting candidate causal variants and for genomic prediction of milk traits.

Conclusions: BayesRC provides a novel and flexible approach to simultaneously improving the accuracy of QTL discovery and genomic prediction by taking advantage of prior biological knowledge. Approaches such as BayesRC will become increasing useful as biological knowledge accumulates regarding functional regions of the genome for a range of traits and species.


Figures

Fig. 1
Fig. 1
a, b and c Accuracy of genomic prediction for real genotypes with simulated phenotypes (3 traits with h2 = 0.6) with a range of BayesR and BayesRC models (AUS-Sim data). BayesR models used 800 K SNP array genotypes or sequence data (SEQ), while all BayesRC models used SEQ data (models described in Table 2). The results are shown for the three simulated traits: a QTL simulated on variants in or close to a set of 790 Lact genes, b QTL simulated on NSC or REG variants only and c QTL simulated at random genome-wide on NSC, REG and CHIP variants
Fig. 2
Fig. 2
The observed proportion of true QTL among variants with posterior probabilities falling in one of five bins (bars) compared to the median posterior probability for variants in each bin (lines). Posterior probabilities are calculated as the proportion of iterations that a variant was estimated to have a real effect on the trait. Results are from the AUS-Sim data (real cattle genotypes with 4000 simulated QTL) for three simulated traits with BayesR SEQ, BayesRC Seq and BayesRC Lact models (see Table 2 for description of BayesRC models)
Fig. 3
Fig. 3
Number of true QTL discovered (log scale) within groups of variants binned on posterior probabilities, for three simulated traits. The sum across all bins is the number of true QTL with posterior probability > 0.01 out of a total of 4000 simulated QTL. Results are shown for the AUS-Sim data (real genotypes with 4000 simulated QTL) applying a range of BayesR and BayesRC models (see Table 2 for description of BayesRC models). Posterior probabilities are calculated as the proportion of iterations that a variant was estimated to have a real effect on the trait
Fig. 4
Fig. 4
Accuracy of prediction (real DANZ data) per variant class of the BayesRC Lact model compared with BayesR predictions using a matching number of randomly selected variants (BayesR_Random). Accuracy was estimated as the correlation between the predicted value and the Red Holstein phenotypes (for Fat, Milk and Protein Yield). The boxplot shows the median and range of values for all replicates (grey dots representing outliers)
Fig. 5
Fig. 5
QTL discovery with GWAS (-log10 of p-value) and BayesRC Lact (posterior probability) for Milk and Protein Yield around the casein gene cluster (yellow highlight) and GC gene. The BayesRC variant with the top probability (real AUS data) is shown by a purple diamond in each plot (labelled with chromosome and bp position). The strength of LD (r2) between this top variant and all others is colour coded
Fig. 6
Fig. 6
QTL discovery with GWAS (-log p-value) and BayesRC Lact (posterior probability) for Milk and Protein Yield across a 1 Mb region of Chromosome 5. The BayesRC variant with the top posterior probability in a given region (real AUS data) is shown by a purple diamond (labelled with chromosome and bp position). The LD (r2) between this variant and all others is colour coded
Fig. 7
Fig. 7
a and b. QTL discovery: posterior probabilities of variants in the PAEP gene region for BayesRC Lact (a) and BayesR SEQ analysis (b). The BayesRC Lact variant with the top posterior probability (real DANZ data) is shown by a purple diamond in each plot (labelled with chromosome and bp position) and the LD (r2) between this variant and all others is colour coded. The position of the SEQ variants fitted in the model is also shown above

References

    1. Meuwissen THE, Hayes BJ, Goddard ME. Prediction of Total Genetic Value Using Genome-Wide Dense Marker Maps. Genetics. 2001;157(4):1819–29. - PMC - PubMed
    1. Moser G, Lee SH, Hayes BJ, Goddard ME, Wray NR, Visscher PM. Simultaneous Discovery, Estimation and Prediction Analysis of Complex Traits Using a Bayesian Mixture Model. PLoS Genet. 2015;11(4):e1004969. doi: 10.1371/journal.pgen.1004969. - DOI - PMC - PubMed
    1. Kemper KE, Reich CM, Bowman P, vander Jagt CJ, Chamberlain AJ, Mason BA, et al. Improved precision of QTL mapping using a nonlinear Bayesian method in a multi-breed population leads to greater accuracy of across-breed genomic predictions. Genet Sel Evol. 2015;47(1):29. doi: 10.1186/s12711-014-0074-4. - DOI - PMC - PubMed
    1. Erbe M, Hayes BJ, Matukumalli LK, Goswami S, Bowman PJ, Reich CM, et al. Improving accuracy of genomic predictions within and between dairy cattle breeds with imputed high-density single nucleotide polymorphism panels. J Dairy Sci. 2012;95(7):4114–29. doi: 10.3168/jds.2011-5019. - DOI - PubMed
    1. MacLeod IM, Hayes BJ, Goddard ME. The Effects of Demography and Long-Term Selection on the Accuracy of Genomic Prediction with Sequence Data. Genetics. 2014;198(4):1671–84. doi: 10.1534/genetics.114.168344. - DOI - PMC - PubMed