. 2016 Jun;131(6):847-63.
doi: 10.1007/s00401-016-1549-x. Epub 2016 Feb 26.

Germline and somatic FGFR1 abnormalities in dysembryoplastic neuroepithelial tumors

Affiliations

Germline and somatic FGFR1 abnormalities in dysembryoplastic neuroepithelial tumors

Barbara Rivera et al. Acta Neuropathol. 2016 Jun.

Abstract

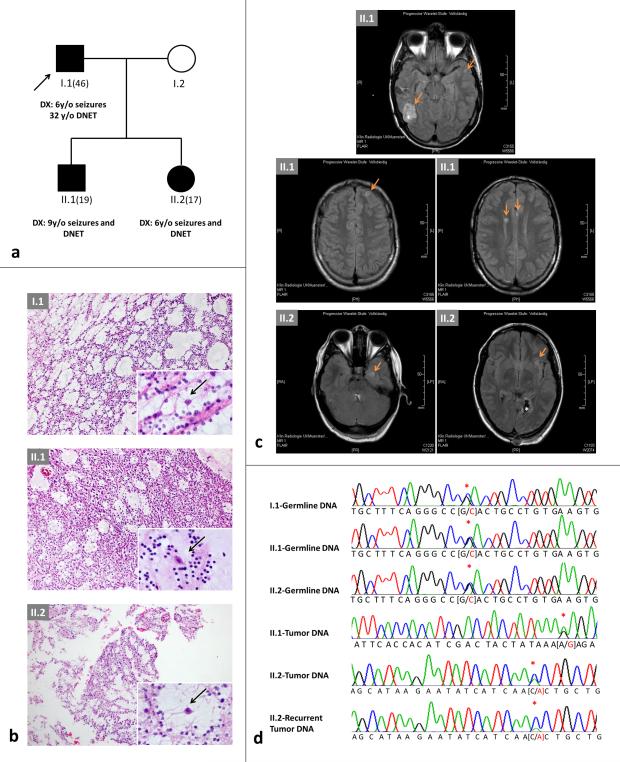
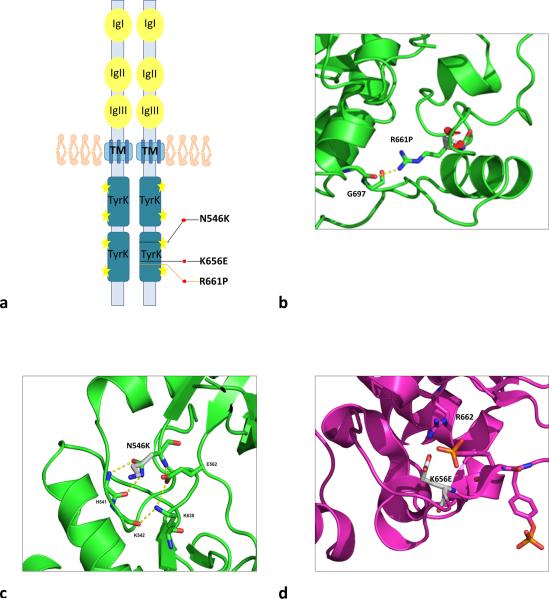
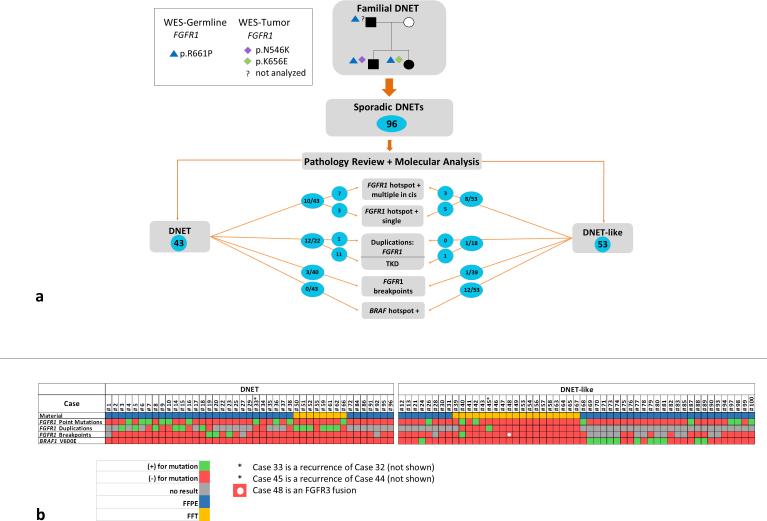
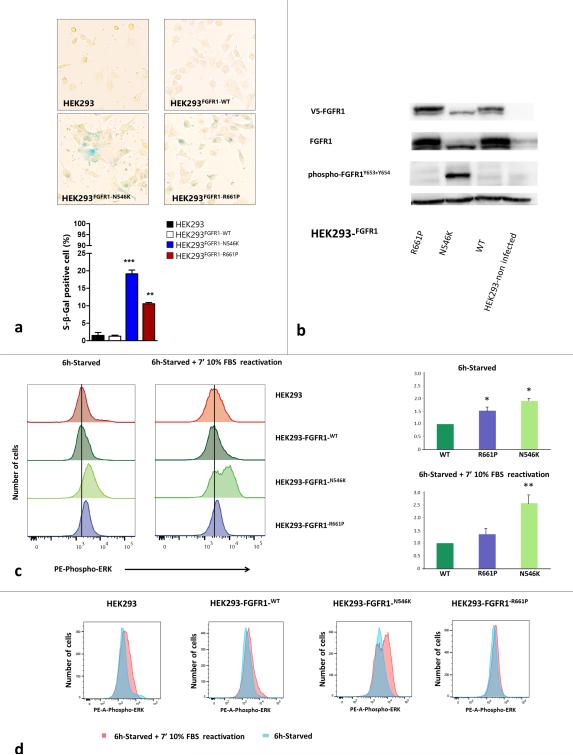
Dysembryoplastic neuroepithelial tumor (DNET) is a benign brain tumor associated with intractable drug-resistant epilepsy. In order to identify underlying genetic alterations and molecular mechanisms, we examined three family members affected by multinodular DNETs as well as 100 sporadic tumors from 96 patients, which had been referred to us as DNETs. We performed whole-exome sequencing on 46 tumors and targeted sequencing for hotspot FGFR1 mutations and BRAF p.V600E was used on the remaining samples. FISH, copy number variation assays and Sanger sequencing were used to validate the findings. By whole-exome sequencing of the familial cases, we identified a novel germline FGFR1 mutation, p.R661P. Somatic activating FGFR1 mutations (p.N546K or p.K656E) were observed in the tumor samples and further evidence for functional relevance was obtained by in silico modeling. The FGFR1 p.K656E mutation was confirmed to be in cis with the germline p.R661P variant. In 43 sporadic cases, in which the diagnosis of DNET could be confirmed on central blinded neuropathology review, FGFR1 alterations were also frequent and mainly comprised intragenic tyrosine kinase FGFR1 duplication and multiple mutants in cis (25/43; 58.1 %) while BRAF p.V600E alterations were absent (0/43). In contrast, in 53 cases, in which the diagnosis of DNET was not confirmed, FGFR1 alterations were less common (10/53; 19 %; p < 0.0001) and hotspot BRAF p.V600E (12/53; 22.6 %) (p < 0.001) prevailed. We observed overexpression of phospho-ERK in FGFR1 p.R661P and p.N546K mutant expressing HEK293 cells as well as FGFR1 mutated tumor samples, supporting enhanced MAP kinase pathway activation under these conditions. In conclusion, constitutional and somatic FGFR1 alterations and MAP kinase pathway activation are key events in the pathogenesis of DNET. These findings point the way towards existing targeted therapies.

Keywords: Brain development; Epilepsy; FGFR signaling; Molecular etiology; Targeted therapy; Whole-exome sequencing.


Figures

Fig. 1
Fig. 1. Family pedigree and imaging, FGFR1 mutations and modelling
a) Pedigree of the family. Age in brackets = current age; y/o = years old; DNET = dysembryoplastic neuroepithelial tumor. b) H & E of the lesions from the pedigree in a); top: I.1; middle: II.1; bottom: II.2. Note the presence of the specific glioneuronal element (insets, higher magnification) with oligodendroglial-like cells and floating neurons (arrows) in all tumors. c) Magnetic resonance imaging. Fluid attenuated inversion recovery (FLAIR) studies of the brain performed in 2014 in II.2 at age 17 years (left) and in II.1 at age 19 years (right). Note the presence of cortical lesions (arrows) in addition to the previously resected and neuropathologically confirmed DNET (*). d) Chromatograms of germline and somatic mutations identified in the family shown in a); red asterisk denotes single basepair change. p.R661P screening was negative in the germline of I.2
Fig. 2
Fig. 2. In silico modelling of FGFR1 mutants found in the index family
a) Schema of FGFR1 protein and mutations observed in the family. The protein is represented as a dimer. Black lines represent somatic mutations, orange line correspond to germline mutation. Yellow stars represent amino acid sites for phosphorylation of the receptor. Immunoglobulin-like domains (IgI, IgII and IgIII) are the ligand binding domains; TM is the transmembrane domain and TyrK are the tyrosine kinase domains. b) Structural modeling of FGFR1 p.R661P mutation. Ribbon diagram of unphosphorylated FGFR1 structure with the position of p.R661P shown, illustrating potential disruption resulting from the mutation. The R661 residue is located in the C-terminal part of the FGFR1 activation loop. In the inhibited FGFR1K structure, the side chain is extended and forms a hydrogen bond to the carbonyl oxygen of G697. In this position, the side chain blocks the binding site for substrate peptides, representing a mechanism by which it may be auto-inhibited [25]. Substitution of the arginine residue at this position with proline (p.R661P) would prevent the formation of this proposed inhibitory hydrogen bond interaction. c) Cartoon diagrams of the unphosphorylated FGFR1 structure with the position of the mutated residues shown, illustrating potential disruption resulting from the p.N546K mutation. The residue N546 is located in the kinase hinge region (the linker between β5 and αD). Notably, the equivalent residue in FGFR2 was shown to be part of a triad of residues that form a network of hydrogen bonds that dissociate in the phosphorylated structure [5]. The triad was proposed to form a molecule brake that keeps the kinase in an auto-inhibited state. The p.N546K mutation would likely disengage the brake and relax the enzyme towards its active state. d) A cartoon diagram of the activated FGFR1 structure showing how p.K656E might interact with R622 and stabilize the active conformation. K656, on the other hand, maps to the activation loop of FGFR1. In the unphosphorylated structure, the K656 side chain is pointing into the solvent but in the phosphorylated structure, it forms hydrogen bond to one of the phosphorylated tyrosine side chains (Y654), stabilizing the active conformation of the activation loop. However, alterations at the corresponding positions in FGFR2 (p.K659N) and FGFR3 (p.K650E) have been shown to be gain of function mutations. One possibility is that the Asp and Glu side chains of p.K656D/E mutants could be hydrogen bonding to the arginine residue (R622) that is adjacent to the aspartate residue that serves as the catalytic base
Fig. 3
Fig. 3. Summary of results according to pathological diagnosis
a) Shown here are the key results from the study, divided according to the outcome of the central pathology review. Only the 96 independent samples are included, representing one sample per case. Alterations found in FGFR1 and BRAF are included in the diagram. TKD = tyrosine kinase domain. b) Detailed schema of results per case and analysis performed. Only the 96 independent samples are shown, grouped by final diagnosis of DNET or non-DNET. Each column represents one case. Samples where information for a given test is not available (e.g. TKD not studied due to poor DNA quality) are shown in gray. Green indicates the presence of an alteration, red indicates no alteration. FFPE: formalin-fixed paraffin-embedded tissue; FFT: fresh frozen tissue
Fig. 4
Fig. 4. Functional studies of the p.R661P and p.N546K mutations in FGFR1 Tyrosine Kinase Domain
a) Senescence marker β-galactosidase staining in p.R661P and p.N546K mutants compared to FGFR1-WT (wild-type) over-expressing cells and non-infected parental cell line HEK293. Graph shows the percentage of β-galactosidase positive cells in HEK293, HEK293-FGFR1-WT, HEK293-FGFR1-N546K and HEK293-FGFR1-R661P. We found a significantly higher number of senescent associated β-galactosidase positive cells (blue cells) in both mutants than in the parental and FGFR-WT overexpressing cell lines (* p < 0.05; ** p < 0.001; *** p < 0.001). Senescence rate was also higher in p.N546K than p.R661P mutants, probably due to a lower level of ERK-signaling in the p.R661P mutant (p < 0.001, one-way ANOVA followed by Tukey's multiple comparison test). b) Immunoblot showing total FGFR1 and phosphorylated FGFR1 across HEK293 parental cell line, FGFR-WT, p.N546K and p.R661P under normal growing conditions (24h growing in 10% FBS media). p.N546K mutant shows a constitutively phosphorylated FGFR1, thus confirming in silico predictions. In contrast, p.R661P mutant shows basal levels of phospho-FGFR1 similar to those observed in FGFR1-WT overexpressing cells. V5-FGFR1 = FGFR1 tagged to V5. c) ERK signalling measurement by assessing phospho-ERK levels in serum deprivation and subsequent reactivation with growth media (10% FBS) for 7 minutes. Left - histograms show phospho-ERK-PE labelled fluorescence in mutants p.R661P, p.N546K and in FGFR1-WT and HEK293 parental cell line. Black vertical line marks median phospho-ERK levels in FGFR1-WT cell line during starvation, highlighting the increased levels in both mutants compare to FGFR1-WT cells. Right - relative fluorescence for p.N546K and p.R661P was calculated from the ratio of fluorescence for each mutant and that of WT from the same experiment, normalizing FGFR1-WT fluorescence to 1.0 under both starvation and stimulation conditions. The results of two technical replicates from three experiments are shown. Error bars shows standard errors in starvation conditions and standard deviations in reactivation conditions. Considering starvation condition as basal level, p.R661P basal levels were higher than FGFR1-WT ( * = p < 0.05 Kruskall Wallis test followed by a Student-Newman-Keuls), differences that were not seen when the stimulation was applied (10% FBS for 7 mins). Under serum deprivation, p.N546K phospho-ERK expression was higher than in both p.R661P and FGFR-WT cells ( both p < 0.05). These differences were accentuated when the cells were reactivated (both p < 0.001). The Kruskall Wallis test followed by a Student-Newman-Keuls method was used in starvation and one-way ANOVA followed by a Student-Newman-Keuls method under reactivation conditions. d) Overlaying of both histograms for phospho-ERK under serum deprivation versus reactivation conditions in each of the cell lines showing the shift in the fluorescence intensity. Only p.N546K shift was significantly increased compare to WT and p.R661P (p < 0.001, one-way ANOVA followed by Tukey's multiple comparison test)
Fig 5
Fig 5. Genotype- phenotype association of previously described mutations in the literature and public databases
Germline mutations are shown on the left of the figure, somatic mutations to the right. The shapes refer to the type of mutation while color code refers to associated pathology as noted in the color key. In the case of several reports of a single mutation associated to a given pathology, the mutation has been plotted only once. Due to the large number of distinct phenotypic entities, we have grouped them according to the tumor site or described congenital syndrome. Note, brain tumors cluster exclusively within the two hotspots. Online Resource 5 to this figure and lists the specific manifestations found in the literature

References

    1. Bae JH, Boggon TJ, Tome F, Mandiyan V, Lax I, Schlessinger J. Asymmetric receptor contact is required for tyrosine autophosphorylation of fibroblast growth factor receptor in living cells. Proc Natl Acad Sci U S A. 2010;107:2866–2871. doi:10.1073/pnas.0914157107. - PMC - PubMed
    1. Barba C, Jacques T, Kahane P, Polster T, Isnard J, Leijten FS, Ozkara C, Tassi L, Giordano F, Castagna M, John A, Oz B, Salon C, Streichenberger N, Cross JH, Guerrini R. Epilepsy surgery in Neurofibromatosis Type 1. Epilepsy Res. 2013;105:384–395. doi:10.1016/j.eplepsyres.2013.02.021. - PubMed
    1. Blümcke I, Aronica E, Urbach H, Alexopoulos A, Gonzalez-Martinez JA. A neuropathology-based approach to epilepsy surgery in brain tumors and proposal for a new terminology use for long-term epilepsy-associated brain tumors. Acta Neuropathol. 2014;128:39–54. doi:10.1007/s00401-014-1288-9. - PMC - PubMed
    1. Chappe C, Padovani L, Scavarda D, Forest F, Nanni-Metellus I, Loundou A, Mercurio S, Fina F, Lena G, Colin C, Figarella-Branger D. Dysembryoplastic neuroepithelial tumors share with pleomorphic xanthoastrocytomas and gangliogliomas BRAF(V600E) mutation and expression. Brain Pathol. 2013;23:574–583. doi:10.1111/bpa.12048. - PMC - PubMed
    1. Chen H, Ma J, Li W, Eliseenkova AV, Xu C, Neubert TA, Miller WT, Mohammadi M. A molecular brake in the kinase hinge region regulates the activity of receptor tyrosine kinases. Mol Cell. 2007;27:717–730. doi:10.1016/j.molcel.2007.06.028. - PMC - PubMed

Publication types

Substances