

A spatial model of the efficiency of T cell search in the influenza-infected lung
- PMID: 26920246
- PMCID: PMC4862360
- DOI: 10.1016/j.jtbi.2016.02.022
A spatial model of the efficiency of T cell search in the influenza-infected lung
Abstract
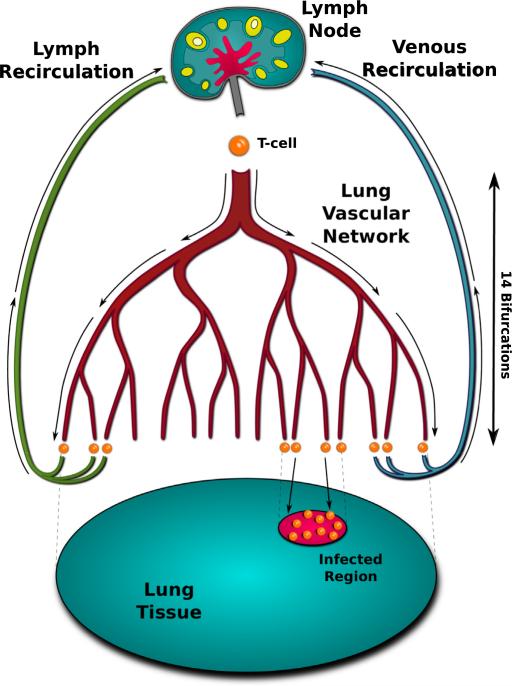
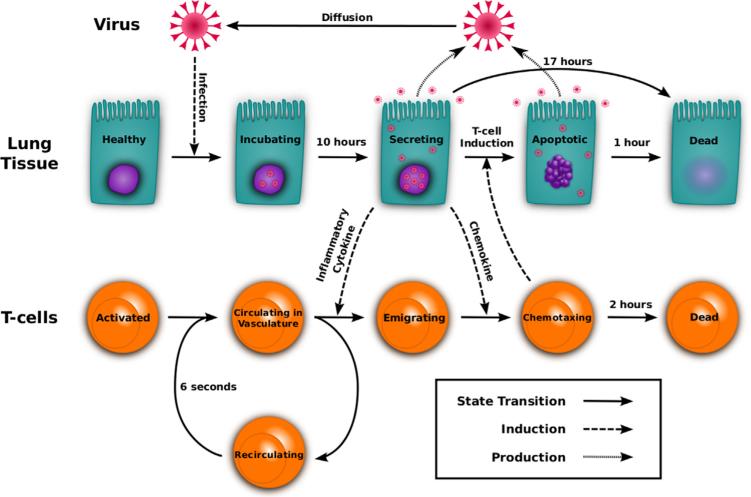
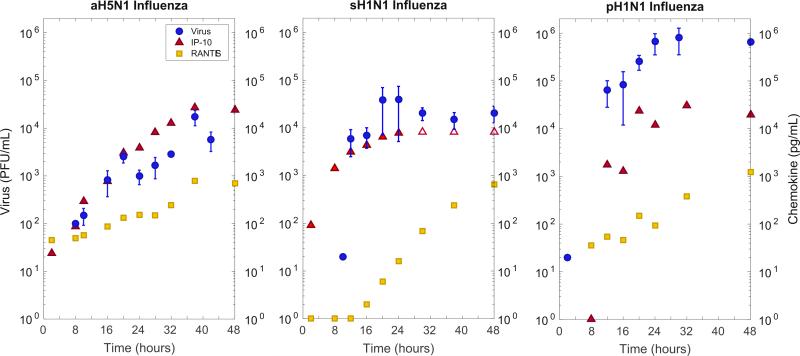
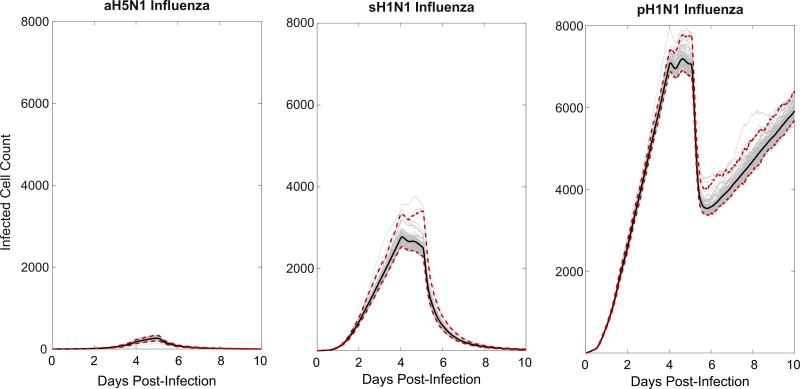
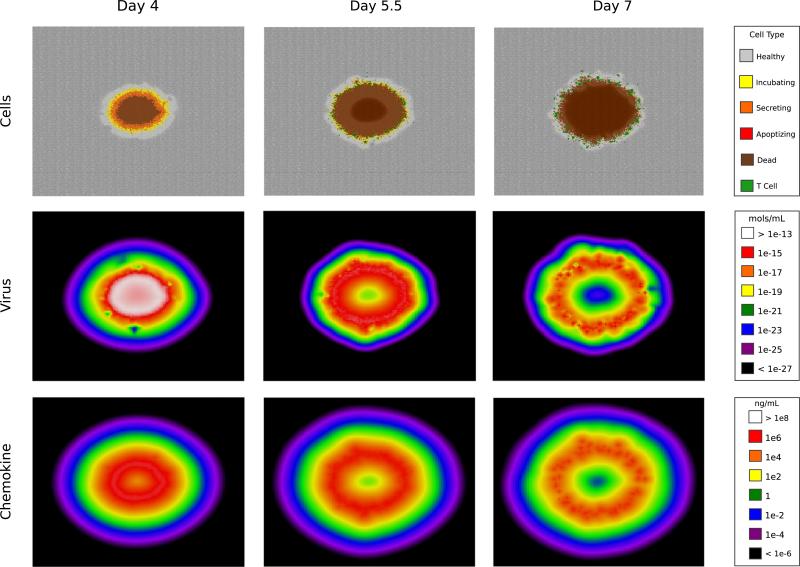
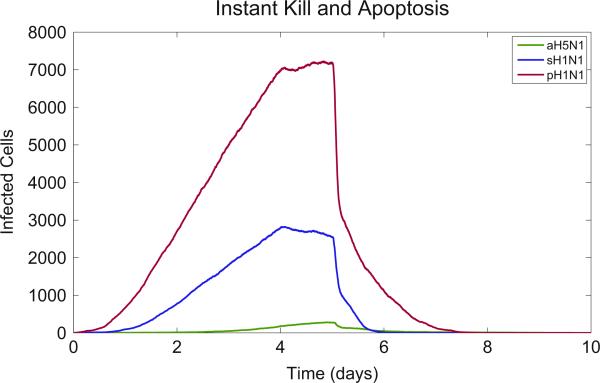
Emerging strains of influenza, such as avian H5N1 and 2009 pandemic H1N1, are more virulent than seasonal H1N1 influenza, yet the underlying mechanisms for these differences are not well understood. Subtle differences in how a given strain interacts with the immune system are likely a key factor in determining virulence. One aspect of the interaction is the ability of T cells to locate the foci of the infection in time to prevent uncontrolled expansion. Here, we develop an agent based spatial model to focus on T cell migration from lymph nodes through the vascular system to sites of infection. We use our model to investigate whether different strains of influenza modulate this process. We calibrate the model using viral and chemokine secretion rates we measure in vitro together with values taken from literature. The spatial nature of the model reveals unique challenges for T cell recruitment that are not apparent in standard differential equation models. In this model comparing three influenza viruses, plaque expansion is governed primarily by the replication rate of the virus strain, and the efficiency of the T cell search-and-kill is limited by the density of infected epithelial cells in each plaque. Thus for each virus there is a different threshold of T cell search time above which recruited T cells are unable to control further expansion. Future models could use this relationship to more accurately predict control of the infection.
Keywords: Agent-based model; Computational biology; Immunology; Systems biology; Virology.
Copyright © 2016 Elsevier Ltd. All rights reserved.
Figures

Similar articles
-
Comparison of the pathology caused by H1N1, H5N1, and H3N2 influenza viruses.Arch Med Res. 2009 Nov;40(8):655-61. doi: 10.1016/j.arcmed.2009.10.001. Epub 2010 Jan 6. Arch Med Res. 2009. PMID: 20304252 Review.
-
2009 pandemic H1N1 influenza A virus strains display differential pathogenicity in C57BL/6J but not BALB/c mice.Virulence. 2011 Nov-Dec;2(6):563-6. doi: 10.4161/viru.2.6.18148. Epub 2011 Nov 1. Virulence. 2011. PMID: 22030859
-
Protective efficacy of an H1N1 cold-adapted live vaccine against the 2009 pandemic H1N1, seasonal H1N1, and H5N1 influenza viruses in mice.Antiviral Res. 2012 Mar;93(3):346-53. doi: 10.1016/j.antiviral.2012.01.001. Epub 2012 Jan 18. Antiviral Res. 2012. PMID: 22281419
-
Inflammatory profiles in severe pneumonia associated with the pandemic influenza A/H1N1 virus isolated in Mexico City.Autoimmunity. 2011 Nov;44(7):562-70. doi: 10.3109/08916934.2011.592885. Epub 2011 Aug 24. Autoimmunity. 2011. PMID: 21838592
-
[Cytokine storm in avian influenza].Mikrobiyol Bul. 2008 Apr;42(2):365-80. Mikrobiyol Bul. 2008. PMID: 18697437 Review. Turkish.
Cited by
-
An agent-based modeling approach for lung fibrosis in response to COVID-19.PLoS Comput Biol. 2023 Dec 21;19(12):e1011741. doi: 10.1371/journal.pcbi.1011741. eCollection 2023 Dec. PLoS Comput Biol. 2023. PMID: 38127835 Free PMC article.
-
Causes and Consequences of Spatial Within-Host Viral Spread.Viruses. 2018 Nov 13;10(11):627. doi: 10.3390/v10110627. Viruses. 2018. PMID: 30428545 Free PMC article. Review.
-
Dynamic Perspectives on the Search for a Universal Influenza Vaccine.J Infect Dis. 2019 Apr 8;219(Suppl_1):S46-S56. doi: 10.1093/infdis/jiz044. J Infect Dis. 2019. PMID: 30715467 Free PMC article.
-
Aerosol Transport Modeling: The Key Link Between Lung Infections of Individuals and Populations.Front Physiol. 2022 Jun 20;13:923945. doi: 10.3389/fphys.2022.923945. eCollection 2022. Front Physiol. 2022. PMID: 35795643 Free PMC article. Review.
-
Spatiotemporal Dynamics of Virus Infection Spreading in Tissues.PLoS One. 2016 Dec 20;11(12):e0168576. doi: 10.1371/journal.pone.0168576. eCollection 2016. PLoS One. 2016. PMID: 27997613 Free PMC article.
References
-
- Abbas AK, Lichtman AHH, Pillai S. Cellular and Molecular Immunology. Saunders; 2011.
-
- Allan RS, Waithman J, Bedoui S, Jones CM, Villadangos JA, Zhan Y, Lew AM, Shortman K, Heath WR, Carbone FR. Migratory dendritic cells transfer antigen to a lymph node-resident dendritic cell population for efficient CTL priming. Immunity. 2006;25(1):153–162. URL 〈 http://www.ncbi.nlm.nih.gov/pubmed/16860764〉. - PubMed
-
- Arndt U, Wennemuth G, Barth P, Nain M, Al-Abed Y, Meinhardt A, Gemsa D, Bacher M. Release of macrophage migration inhibitory factor and CXCL8/interleukin-8 from lung epithelial cells rendered necrotic by influenza A virus infection. J. Virol. 2002;76(18):9298–9306. URL 〈 http://view.ncbi.nlm.nih.gov/pubmed/12186913〉. - PMC - PubMed
-
- Bachem A, Hochstättler W, Malich M. The simulated trading heuristic for solving vehicle routing problems. Discret. Appl. Math. 1996;65(1):47–72.
-
- Banerjee S, Moses M. Scale invariance of immune system response rates and times: perspectives on immune system architecture and implications for artificial immune systems. Swarm Intell. 2010;4(4):301–318. http://dx.doi.org/10.1007/s11721-010-0048-2, ISSN 1935-3812, URL 〈 http://www.springerlink.com/index/10.1007/s11721-010-0048-2〉. - DOI - DOI
Publication types
MeSH terms
Substances
Grants and funding
LinkOut - more resources
Full Text Sources
Other Literature Sources
Medical
