. 2016 Jun;37(6):2039-54.
doi: 10.1002/hbm.23155. Epub 2016 Feb 27.

Microstructural properties of premotor pathways predict visuomotor performance in chronic stroke

Affiliations

Microstructural properties of premotor pathways predict visuomotor performance in chronic stroke

Derek B Archer et al. Hum Brain Mapp. 2016 Jun.

Abstract

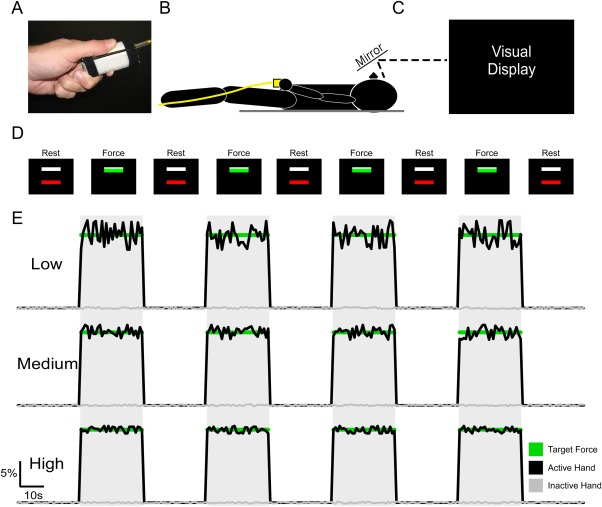
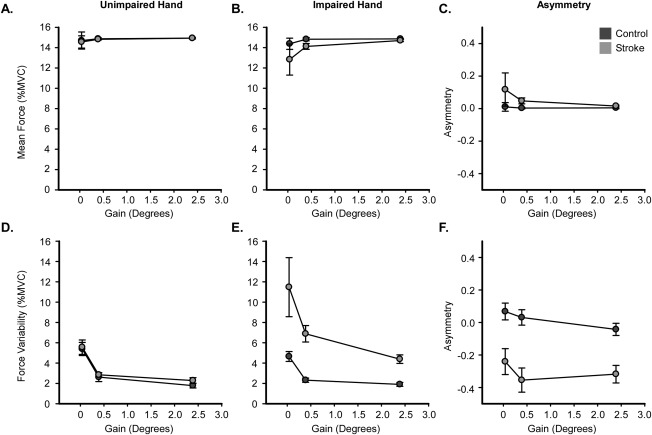
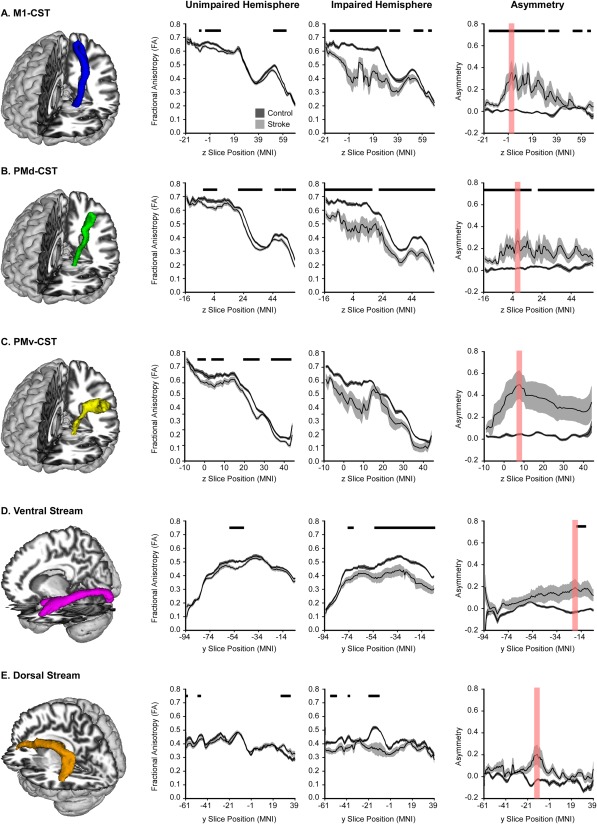
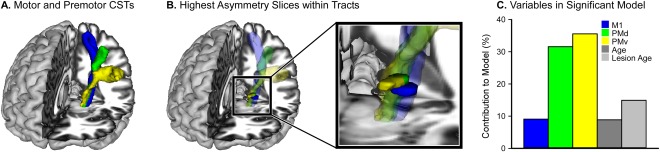
Microstructural properties of the corticospinal tract (CST) descending from the motor cortex predict strength and motor skill in the chronic phase after stroke. Much less is known about the relation between brain microstructure and visuomotor processing after stroke. In this study, individual's poststroke and age-matched controls performed a unimanual force task separately with each hand at three levels of visual gain. We collected diffusion MRI data and used probabilistic tractography algorithms to identify the primary and premotor CSTs. Fractional anisotropy (FA) within each tract was used to predict changes in force variability across different levels of visual gain. Our observations revealed that individuals poststroke reduced force variability with an increase in visual gain, performed the force task with greater variability as compared with controls across all gain levels, and had lower FA in the primary motor and premotor CSTs. Our results also demonstrated that the CST descending from the premotor cortex, rather than the primary motor cortex, best predicted force variability. Together, these findings demonstrate that the microstructural properties of the premotor CST predict visual gain-related changes in force variability in individuals poststroke. Hum Brain Mapp 37:2039-2054, 2016. © 2016 Wiley Periodicals, Inc.

Keywords: chronic stroke; corticospinal tract; diffusion tensor imaging; fractional anisotropy; tractography; visual gain.


Figures

Figure 1
Figure 1
Experimental Setup. The force transducer was held between the thumb and the index finger by the subject during the MRI session (A), and the subject laid in the supine position in which the hand and transducer rested at the lower trunk (B). Above the field of view of the subject was a mirror, which reflected the visual display (C). The visual display instructed the subject when to produce force. The subject initially saw two bars (one red, one white) on the black screen, which indicated the “Rest” condition. The white bar was set at 15% of each subject's MVC. Following the 30 s Rest condition, the red bar would turn green which indicated the “Force” condition. Subjects were instructed, which hand to use before the task began, and to produce no force with their other hand. During the force condition, the goal was to produce 15% MVC, which would cover the white bar so that it was not visible. Following the Force condition, the trial was repeated. This was repeated four times for each gain level, and for each hand. E: Example data is shown for each gain level. Force data corresponds with the visual display instructions shown in D. The green line represents 15% MVC, the black line represents force data for the hand used in the task, and the gray line represents force data for the hand not used in the task.
Figure 2
Figure 2
Lesion Conjunction Map. The lesion conjunction across subjects shown on a series of axial T1 slices. The color bar represents the number of individuals with a lesion in each voxel. Dark colors (red) indicate fewer subjects with a lesion in the same voxel, whereas brighter colors (yellow) indicate higher lesion overlap in the same voxel.
Figure 3
Figure 3
Force Amplitude and Force Variability. Mean force amplitude is shown for the unimpaired (A) and impaired hand (B) for both the control (dark gray) and stroke (light gray) groups. C: shows the asymmetry of mean force amplitude for both groups. Force variability is shown for the unimpaired (D) and impaired hand (E) for both groups. Corresponding asymmetry values are shown in F. Each data point represents the group mean at each level of visual gain, and error bars represent ± SEM.
Figure 4
Figure 4
Probabilistic Tractography in Motor and Visual Tracts. FA profiles of all motor and visual tracts. The mean FA for each group is displayed with a black line, and the dark gray (control) and light gray (stroke) shaded areas represent ± SEM for each group. Comparisons were made in the unimpaired hemisphere and impaired hemisphere, with FDR corrected P < 0.05 represented with horizontal black lines in each plot. Asymmetry of each slice within each tract was also calculated, and is displayed in the final column. The slice with the highest asymmetry is highlighted in red, and represents the region used to extract data for the multiple regression analyses.
Figure 5
Figure 5
Contribution to Force Variability. A: The three CST's overlaid on a T1 template (M1 – blue, PMd – green, PMv – yellow). B: The largest between group differences in FA asymmetry were found in the PLIC for each motor CST. The black box magnifies the PLIC region of the tract and shows these regions in solid colors superimposed over the corresponding transparent CSTs. C: The contribution of each ROI and behavioral variable to the model that best predicted force variability across all levels of the visual gain task.

References

    1. Abdollahi F, Case Lazarro ED, Listenberger M, Kenyon RV, Kovic M, Bogey RA, Hedeker D, Jovanovic BD, Patton JL (2013): Error Augmentation Enhancing Arm Recovery in Individuals With Chronic Stroke: A Randomized Crossover Design. Neurorehabil Neural Repair 28:120–128. - PMC - PubMed
    1. Bagce HF, Saleh S, Adamovich SV, Tunik E (2012): Visuomotor gain distortion alters online motor performance and enhances primary motor cortex excitability in patients with stroke. Neuromodulation 15:361–366. - PMC - PubMed
    1. Bastian AJ (2006): Learning to predict the future: the cerebellum adapts feedforward movement control. Curr Opin Neurobiol 16:645–649. - PubMed
    1. Bohannon RW, Smith MB (1987): Interrater reliability of a modified Ashworth scale of muscle spasticity. Phys Ther 67:206–207. - PubMed
    1. Brewer BR, Fagan M, Klatzky RL, Matsuoka Y (2005): Perceptual limits for a robotic rehabilitation environment using visual feedback distortion. IEEE Trans Neural Syst Rehabil Eng 13:1–11. - PubMed

MeSH terms