. 2016 May;203(1):369-85.
doi: 10.1534/genetics.115.183863. Epub 2016 Feb 26.

σ2-Adaptin Facilitates Basal Synaptic Transmission and Is Required for Regenerating Endo-Exo Cycling Pool Under High-Frequency Nerve Stimulation in Drosophila

Affiliations

σ2-Adaptin Facilitates Basal Synaptic Transmission and Is Required for Regenerating Endo-Exo Cycling Pool Under High-Frequency Nerve Stimulation in Drosophila

Saumitra Dey Choudhury et al. Genetics. 2016 May.

Abstract

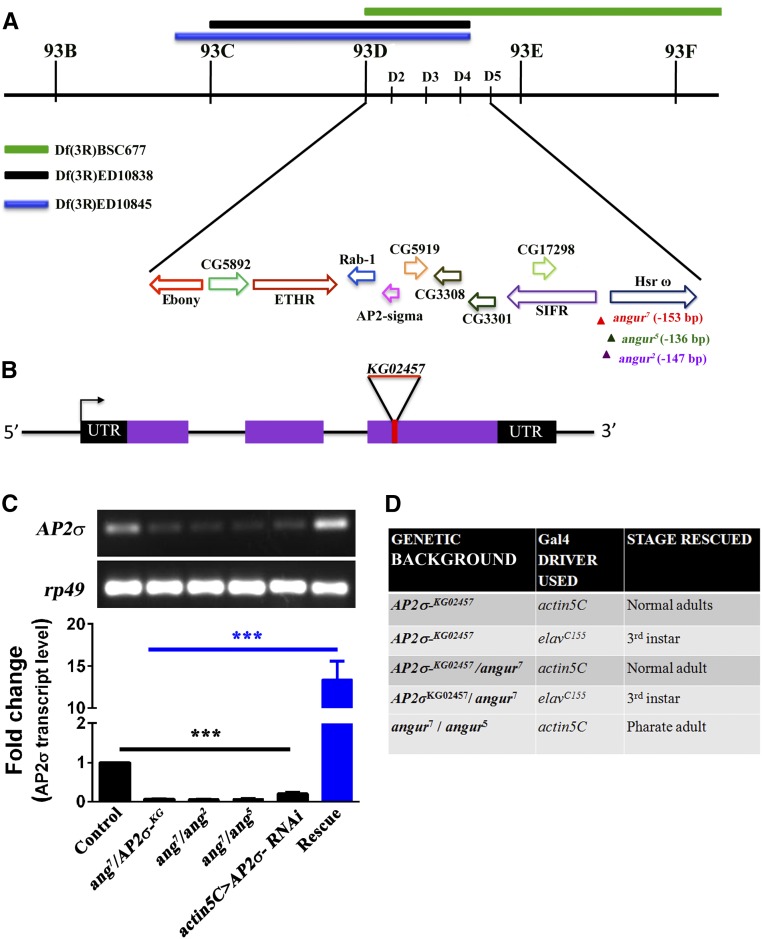
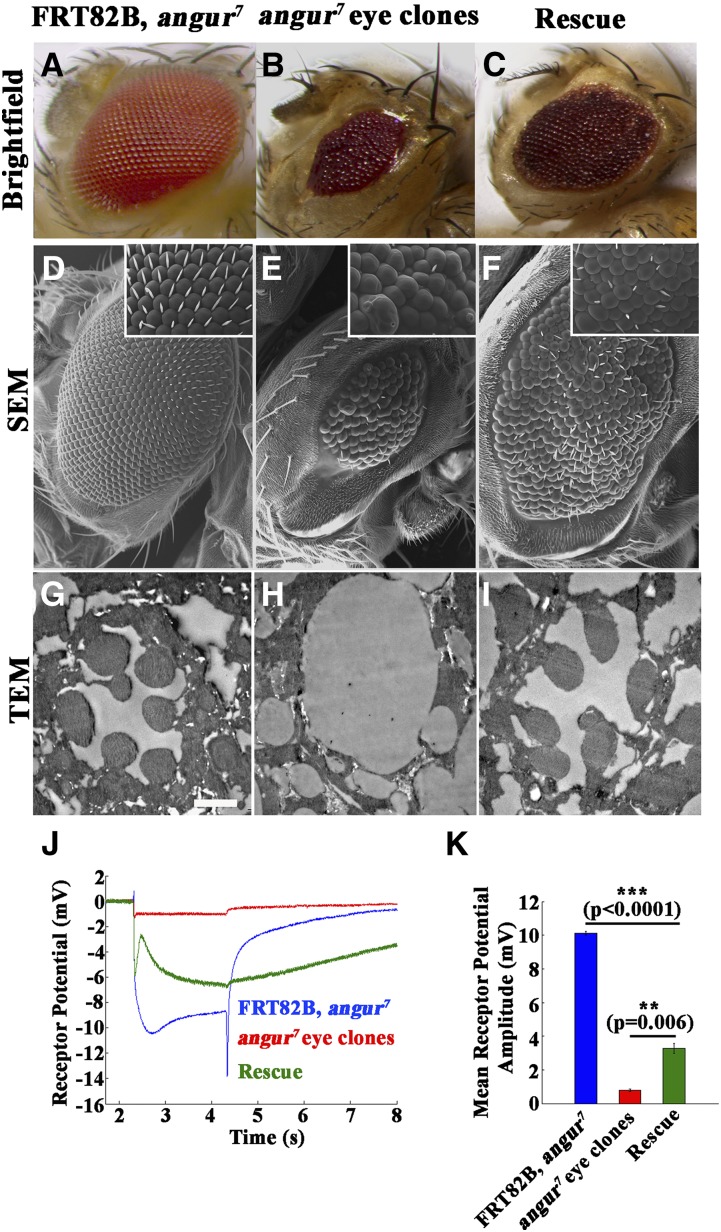
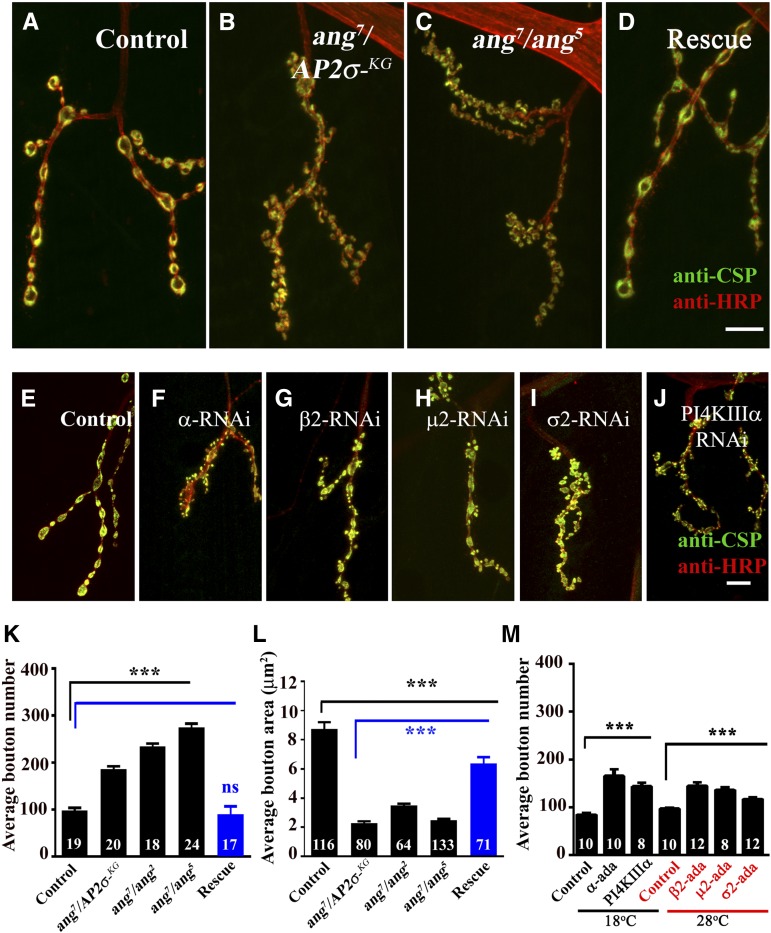
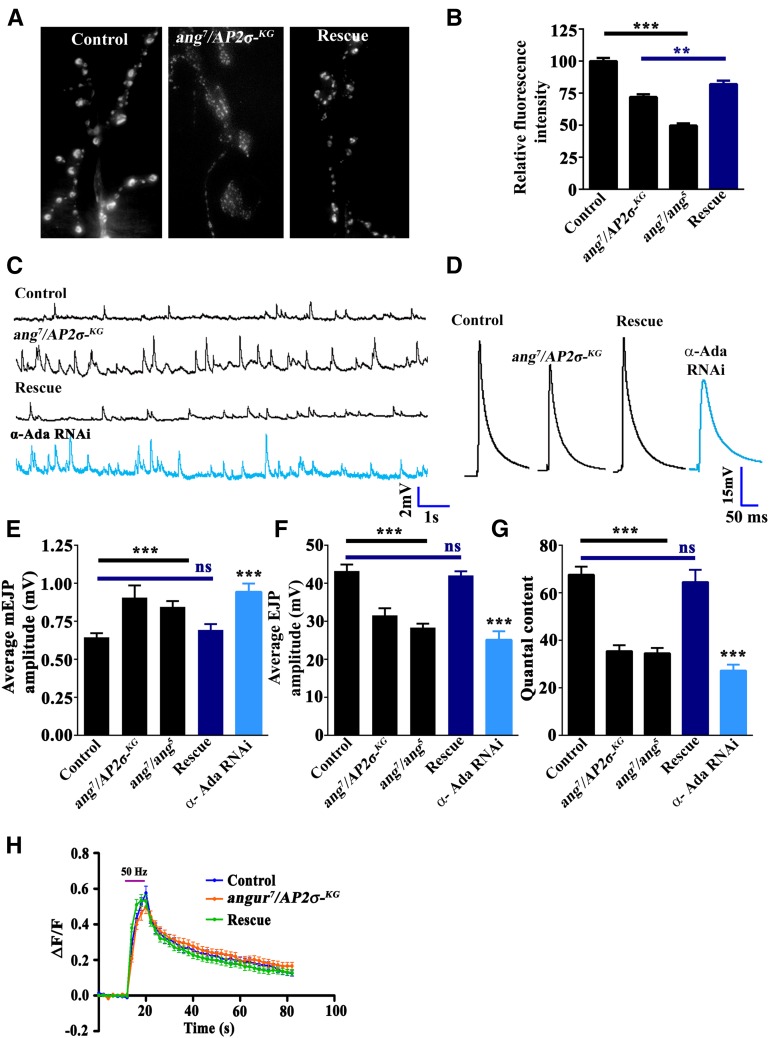
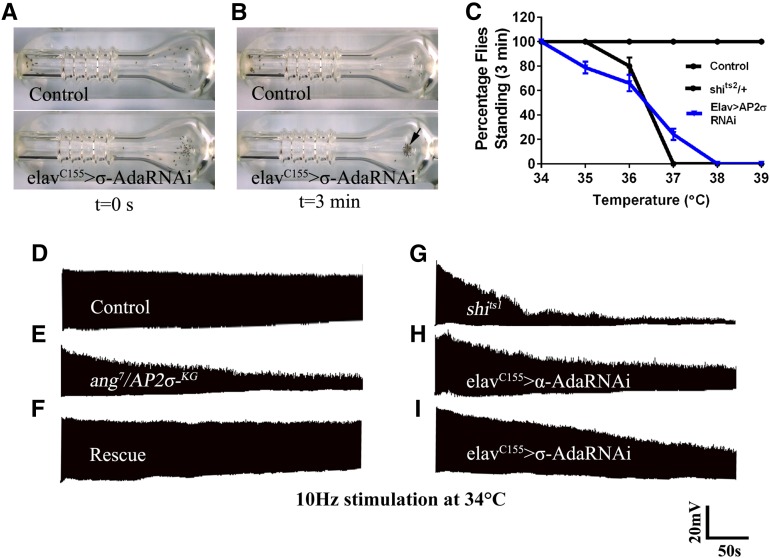
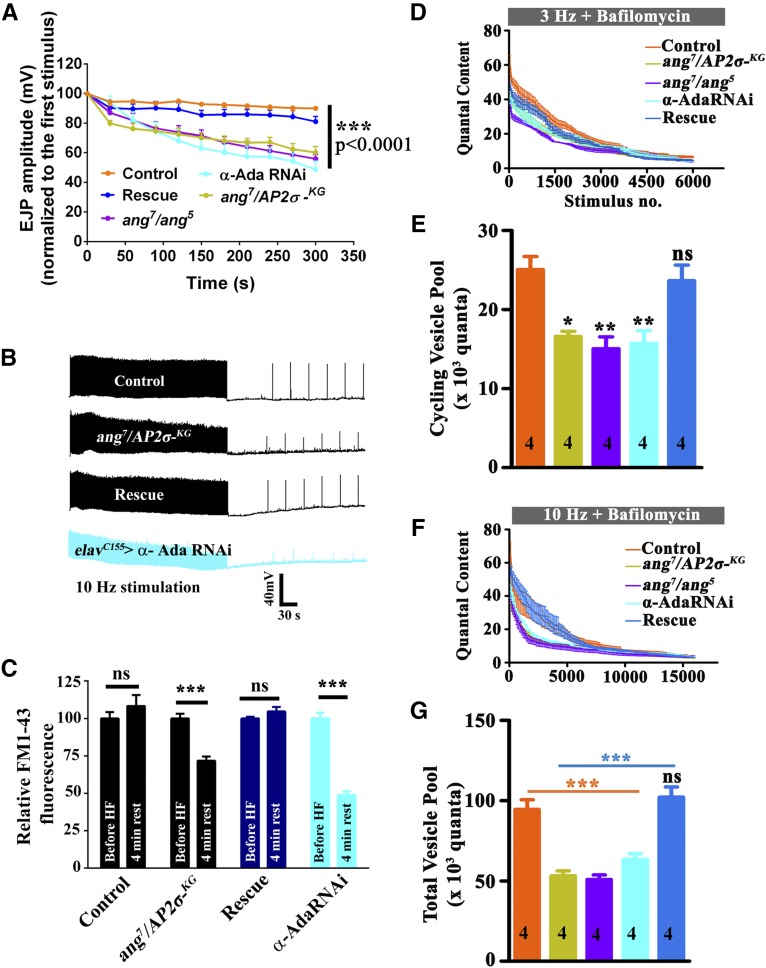
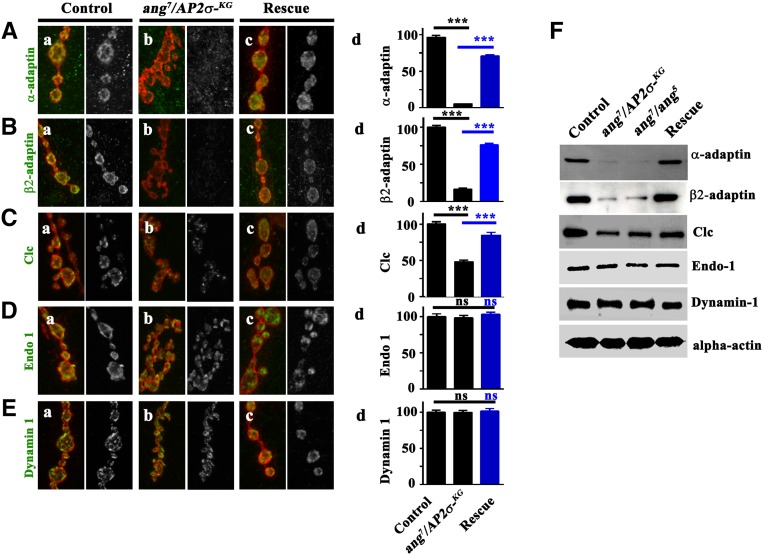
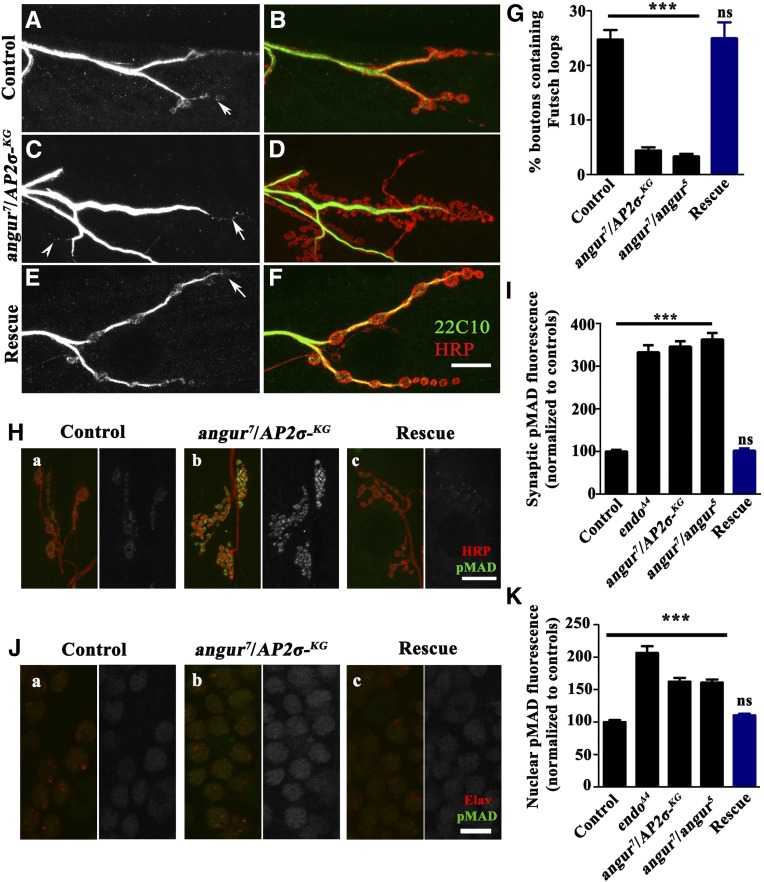
The functional requirement of adapter protein 2 (AP2) complex in synaptic membrane retrieval by clathrin-mediated endocytosis is not fully understood. Here we isolated and functionally characterized a mutation that dramatically altered synaptic development. Based on the aberrant neuromuscular junction (NMJ) synapse, we named this mutation angur (a Hindi word meaning "grapes"). Loss-of-function alleles of angur show more than twofold overgrowth in bouton numbers and a dramatic decrease in bouton size. We mapped the angur mutation to σ2-adaptin, the smallest subunit of the AP2 complex. Reducing the neuronal level of any of the subunits of the AP2 complex or disrupting AP2 complex assembly in neurons phenocopied the σ2-adaptin mutation. Genetic perturbation of σ2-adaptin in neurons leads to a reversible temperature-sensitive paralysis at 38°. Electrophysiological analysis of the mutants revealed reduced evoked junction potentials and quantal content. Interestingly, high-frequency nerve stimulation caused prolonged synaptic fatigue at the NMJs. The synaptic levels of subunits of the AP2 complex and clathrin, but not other endocytic proteins, were reduced in the mutants. Moreover, bone morphogenetic protein (BMP)/transforming growth factor β (TGFβ) signaling was altered in these mutants and was restored by normalizing σ2-adaptin in neurons. Thus, our data suggest that (1) while σ2-adaptin facilitates synaptic vesicle (SV) recycling for basal synaptic transmission, its activity is also required for regenerating SVs during high-frequency nerve stimulation, and (2) σ2-adaptin regulates NMJ morphology by attenuating TGFβ signaling.

Keywords: Drosophila; angur; pMAD; physiology; synapse.


Figures

Figure 1
Figure 1
angur is an allele of σ2-adaptin, the smallest subunit of adapter protein 2 (AP2) complex. (A) Deficiency mapping showed the angur locus to be located in the region of 93D1–93D4 on the third chromosome of Drosophila. The three deficiency lines that uncovered the angur locus—Df(3R)BSC677, Df(3R)ED10838, and Df(3R) ED10845—are labeled. Solid bars mark the deleted regions in these deficiency lines. The 93D1–93D4 region of the chromosome contains at least 10 identified genes. Different colored arrows represent the relative positions and orientations of the genes in the 93D1–93D4 region. While angur7 and angur2 were obtained from mobilization of EP0877, angur5 was obtained from mobilization of KG06118b. The P-element in angur alleles was located in the 5′ end of the hsrω gene but did not affect expression of the hsrω gene. (B) Genomic organization of the σ2-adaptin locus showing exons (represented by solid boxes) and introns (represented by thin lines). The transcription start site is represented by an arrow, and the untranslated regions are shown by black solid boxes. The insertion site of P-element KG02457 lies in the third exon of the gene. (C) Semiquantitative (top panel) and quantitative RT-PCR (bottom panel) depicting transcript levels of σ2-adaptin in controls, angur7/AP2σKG02457, angur7/angur2, angur7/angur5, actin5C-Gal4-driven σ2-adaptin RNAi, and rescued heteroallelic mutant (actin5C/+; angur7/UAS-AP2σ, AP2σKG02457), respectively. σ2-adaptin transcript level is dramatically reduced in the heteroallelic mutants or actin5C-Gal4-driven σ2-adaptin RNAi. rp49 transcript level was used as an internal concentration control for messenger RNA (mRNA). The error bars in the bottom panel represent SEM. Statistical analysis based on one-way ANOVA followed by post-hoc Tukey’s multiple comparison test. (D) Rescue of AP2σKG02457 mutants and heteroallelic combinations in homozygous or transheterozygous combinations using ubiquitous actin5C-Gal4 or the neuronal elavC155-Gal4 drivers.
Figure 2
Figure 2
angur mutant eye clones show severe defects in rhabdomere development. (A–C) Brightfield images of (A) control (FRT82B, angur7), (B) mutant angur7 eye clone (EGUF/+; FRT82B, angur7/FRT82B, GMR-hid), and (C) transgene-rescued animal (EGUF/+; FRT82B, angur7, UAS-AP2σ/FRT82B, GMR-hid). (D–F) SEMs of (D) control (FRT82B, angur7), (E) mutant angur7 eye clone (EGUF/+; FRT82B, angur7/FRT82B, GMR-hid), and (F) transgene-rescued animal (EGUF/+; FRT82B, angur7, UAS-AP2σ/FRT82B, GMR-hid). (G–I) TEMs of (G) control (FRT82B, angur7), (H) mutant angur7 eye clone (EGUF/+; FRT82B, angur7/FRT82B, GMR-hid), and (I) transgene-rescued animal (EGUF/+; FRT82B, angur7, UAS-AP2σ/FRT82B, GMR-hid). Scale bar, 2 μm. (J) ERG traces of control animals (FRT82B, angur7) shown in blue, mutant angur7 eye clone animals (EGUF/+; FRT82B, angur7/FRT82B, GMR-hid) shown in red, and transgene-rescued animal (EGUF/+; FRT82B, angur7, UAS-AP2σ/FRT82B, GMR-hid) shown in green. (K) Histogram showing quantification of receptor potential amplitudes of the preceding genotypes. ***P < 0.0001. Error bars represent standard error of the mean. Statistical analysis based on one-way ANOVA followed by post-hoc Tukey’s multiple-comparison test. Note that compared to the mutant eye clones, the rescued animals showed mild but significant rescue of receptor potential depolarization.
Figure 3
Figure 3
Mutation in σ2-adaptin causes aberrant neuromuscular junction formation. (A–D) Confocal image of NMJ synapses at muscle 4 of (A) control animals, (B and C) heteroallelic σ2-adaptin mutants (angur7/AP2σKG02457 and angur7/angur5), and (D) transgene-rescued animal (actin5C/+; angur7/UAS-AP2σ, AP2σKG02457) double immunolabeled with a presynaptic marker CSP (green) and neuronal membrane marker HRP (red) to reveal the bouton outline. Compared to the control NMJ, the heteroallelic combination of σ2-adaptin shows severely altered NMJ morphology. Scale bar, 15 μm. (E–J) Confocal images of NMJ synapses at muscle 4 co-labeled with CSP (green) and HRP (red) of (E) control and (F–J) neuronally expressing RNAi against AP2 complex subunits or PI4KIIIα: (F) elavC155/+; α-adaptin RNAi/+, (G) elavC155/+; β2-adaptin RNAi/UAS-Dicer, (H) elavC155/+; μ2-adaptin RNAi/UAS-Dicer, (I) elavC155/+; σ2-adaptin RNAi/UAS-Dicer, and (J) elavC155/+; PIK4IIIαRNAi/+. Note that neuronal knockdown of any of the subunits of the AP2 complex or PIK4IIIα phenocopies σ2-adaptin mutations. Scale bar, 15 μm. (K) Histogram showing average number of boutons at muscles 6/7 of the A2 hemisegment in control animals (98.2 ± 4.8), heteroallelic σ2-adaptin mutants (angur7/AP2σKG02457: 185.4 ± 6; angur7/angur2: 233.4 ± 7; angur7/angur5: 274 ± 8.5) and the rescued animals (actin5C/+; angur7/UAS-AP2σ, AP2σKG02457: 89.9 ± 4.0). The numbers in columns represent the number of 6/7 NMJs of the A2 segment used for bouton quantification. ***P < 0.0001. Error bars represent standard error of the mean. Statistical analysis based on one-way ANOVA followed by post-hoc Tukey’s multiple-comparison test. (L) Histogram showing average bouton area in control animals (8.7 ± 0.5 μm2), heteroallelic σ2-adaptin mutants (angur7/AP2σKG02457: 2.3 ± 0.13 μm2; angur7/angur2: 3.5 ± 0.12 μm2; angur7/angur5: 2.5 ± 0.1 μm2) and rescued animals (actin5C/+; angur7/UAS-AP2σ, AP2σKG02457: 6.4 ± 0.4 μm2). The numbers in columns represent the number of boutons used for quantification. ***P < 0.0001. Error bars represent standard error of the mean. Statistical analysis based on one-way ANOVA followed by post-hoc Tukey’s multiple-comparison test. (M) Histogram showing quantification of average bouton numbers at muscles 6/7 of the A2 hemisegments of third instar larvae in control animals and neuronally expressing RNAi against AP2 subunits (control at 18°, 85 ± 3; control at 28°, 98 ± 2; α-adaptin, 167 ± 13; β2-adaptin, 145 ± 7.0; μ2-adaptin, 137 ± 5; σ2-adaptin, 118 ± 4) or PI4KIIIα (144 ± 7). At least 16 NMJ synapses of muscles 6/7 of the A2 hemisegment of each genotype were used for counting the number of boutons. ***P < 0.0001. The numbers in the columns represent the number of animals used for quantification. Error bars represent standard error of the mean. Statistical analysis based on one-way ANOVA followed by post-hoc Tukey’s multiple-comparison test.
Figure 4
Figure 4
σ2-adaptin facilitates basal synaptic transmission as well as synaptic vesicle endocytosis. (A) Representative images of FM1-43 dye uptake by control, heteroallelic σ2-adaptin mutant (angur7/AP2σKG02457), and transgene-rescued (actin5C/+; angur7/UAS-AP2σ, AP2σKG02457) synapses. (B) Relative synaptic FM1-43 fluorescence uptake in control, heteroallelic σ2-adaptin mutant (angur7/AP2σKG02457: 72.1 ± 2.3% and angur7/angur5: 49.73 ± 1.7%) and transgene-rescued (actin5C/+; angur7/UAS-AP2σ, AP2σKG02457: 82.1 ± 2.6%) synapses. ***P < 0.0001; **P < 0.001. Error bars represent standard error of the mean. Statistical analysis based on one-way ANOVA followed by post-hoc Tukey’s multiple-comparison test. (C) Representative traces of mEJP in control animals, heteroallelic σ2-adaptin mutant combinations (angur7/AP2σKG02457 and angur7/angur5), transgenic-rescued animals (actin5C/+; angur7/UAS-AP2σ, AP2σKG02457), and elavC155/+; α-adaptin RNAi/+ animals. (D) Representative traces of EJPs in control animals, σ2-adaptin heteroallelic mutant combinations (angur7/AP2σKG02457 and angur7/angur5), transgene-rescued animals (actin5C/+; angur7/UAS-AP2σ, AP2σKG02457), and elavC155/+; α-adaptin RNAi/+ animals. (E) Histogram showing average mEJP amplitude in control animals (0.65 ± 0.03 mV), heteroallelic σ2-adaptin mutants (angur7/AP2σKG02457: 0.91 ± 0.08 mV; angur7/angur5: 0.85 ± 0.04 mV), transgene-rescued animals (actin5C/+; angur7/UAS-AP2σ, AP2σKG02457: 0.69 ± 0.04 mV), and elavC155/+; α-adaptin RNAi/+ (0.94 ± 0.06 mV) animals. At least 8 NMJ recordings of each genotype were used for quantification. ***P < 0.0001. Error bars represent standard error of the mean. Statistical analysis based on one-way ANOVA followed by post-hoc Tukey’s multiple-comparison test. (F) Histogram showing average EJP amplitude in control animals (43.25 ± 1.67 mV), heteroallelic σ2-adaptin mutants (angur7/AP2σKG02457: 31.60 ± 1.9 mV; angur7/angur5: 28.34 ± 1.05 mV), transgene-rescued animals (actin5C/+; angur7/UAS-AP2σ, AP2σKG02457: 42.06 ± 1.14 mV), and elavC155/+; α-adaptin RNAi/+ (25.17 ± 2.24 mV) animals. At least 8 NMJ recordings of each genotype were used for quantification. ***P < 0.0001. Error bars represent standard error of the mean. Statistical analysis based on one-way ANOVA followed by post-hoc Tukey’s multiple-comparison test. (G) Quantification of quantal content in control animals (67.63 ± 3.37), heteroallelic σ2-adaptin mutants (angur7/AP2σKG02457: 35.48 ± 2.45; angur7/angur5: 34.54 ± 2.25), transgene-rescued animals (actin5C/+; angur7/UAS-AP2σ, AP2σKG02457: 64.54 ± 5.18), and elavC155/+; α-adaptin RNAi/+ (27.26 ± 2.53) animals. ***P < 0.0001. Error bars represent standard error of the mean. Statistical analysis based on one-way ANOVA followed by post-hoc Tukey’s multiple-comparison test. (H) Graph showing the SpH fluorescence response to a 50-Hz stimulus train for 10 sec in 2.0 mM Ca2+ containing HL3 of control (blue, n = 37 boutons, 5 animals; elav3E1, UAS-SpH/+), mutant (orange, n = 33 boutons, 5 animals; elav3E1, UAS-SpH, AP2σKG02457/ang7), and rescued (green, n = 29 boutons, 5 animals; elav3E1, UAS-SpH, AP2σKG02457/ang7, UAS-AP2σ) synapses. The pink horizontal bar represents the stimulation time. Tau values were calculated after 10 sec of stimulation by fitting the fluorescence decay curve to one-phase exponential. σ2-adaptin mutant (7.60 ± 0.17) shows a mild but significant difference in SpH kinetics compared to control (6.91 ± 0.17) and rescue (6.60 ± 0.23).
Figure 5
Figure 5
Reducing σ2-adaptin levels in neurons causes temperature-sensitive paralysis at elevated temperature. (A and B) Control (elavC155/+) 2- to 3-day-old adult flies do not suffer paralysis in 3 min at 38ο, whereas similarly aged adult flies expressing σ2-adaptin RNAi (elavC155/+; σ2-adaptin RNAi/+) in neurons showed complete paralysis in 3 min at 38ο. These animals recovered within 2 min when shifted to 25ο (not shown). (C) Paralysis profile of control animals and animals expressing RNAi against σ2-adaptin in neurons (elavC155/+; σ2-adaptin RNAi/+) and shits2/+. While the control animals do not suffer paralysis in 3 min, the RNAi-expressing animals are paralyzed above 35ο. Five trials were performed for each genotype at each temperature in a sushi cooker (Ramaswami et al. 1993). Each trial contained 10–15 animals. Error bars represent standard error of the mean. (D–I) Representative traces of EJPs under high-frequency stimulation of indicated genotypes stimulated at 10 Hz for 5 min at 34° in 1.5 mM Ca2+ containing HL3. Unlike shibrets1 (G), mutant (E) and neuronally reduced α- or σ2- adaptin (H and I) animals do not show complete reduction in EJP amplitude at the end of 5 min of stimulation.
Figure 6
Figure 6
σ2-adaptin function is essential under high-frequency stimulation to regenerate synaptic vesicles. (A) Normalized EJP amplitudes in control, heteroallelic σ2-adaptin mutant (angur7/AP2σKG02457and angur7/angur5), rescued larvae (actin5C/+; angur7/UAS-AP2σ, AP2σKG02457), and neuronally knocked down α-adaptin (elavC155/+; α-adaptin RNAi/+) animals stimulated at 10 Hz for 5 min in 1.5 mM Ca2+. The mutant larvae showed stimulus-dependent decline in the EJP amplitudes over time. (B) Representative traces of indicated genotypes under high-frequency stimulation at 10 Hz for 5 min in 1.5 mM Ca2+ containing HL3. After 1.5 min of rest, test stimuli were given every 30 sec to assess the recovery of EJP from synaptic depression. Note that the mutant synapses do not recover to the first stimulus levels even after 4 min of rest from high-frequency stimulation. (C) Estimation of endo-exo cycling pool at NMJ synapses of indicated genotypes before high-frequency stimulation and after 4 min of rest from high-frequency stimulation. While the controls and rescue synapses maintained the ECP pool to its initial value after 4 min of rest, the σ2-adaptin mutant synapses and the elavC155/+; α-adaptin RNAi/+ synapses show significant decline in the endo-exo cycling pool and do not recover to the initial value after 4 min of rest. n = 50 boutons from eight different NMJs of muscles 6/7 of the A2 hemisegment were counted. (D) Synaptic depression curve showing the depletion in quantal content over stimulus number in synapses stimulated at 3 Hz in the presence of 1 μM Bafilomycin A1 to deplete ECP. (E) Histogram showing ECP estimates of control (25,050 ± 1511), heteroallelic mutants (angur7/AP2σKG02457: 16,590 ± 974; angur7/angur5: 15,040 ± 870), elavC155/+; α-adaptin RNAi/+ (15,730 ± 1031), and rescued animals (actin5C-GAL4/+; angur7/UAS-AP2σ, AP2σKG02457: 23,635 ± 1358) obtained from Y-intercept of regression, calculated by back-extrapolating from stimulus numbers 3800–6000 on a cumulative plot of Figure 6D. **P ≤ 0.0006; *P ≤ 0.0007. Numbers in the columns represent the number of animals used for experiments and quantification. The error bars represent standard error of the mean. Statistical analysis based on one-way ANOVA followed by post-hoc Tukey’s multiple-comparison test. (F) Synaptic depression curve showing the depletion of the total vesicle pool over stimulus number estimated by stimulating the synapses at 10 Hz in presence of 1 μM Bafilomycin A1. (G) Histogram showing the estimation of total vesicle pool of control animals (94,610 ± 5929), heteroallelic mutants (angur7/AP2σKG02457: 53,220 ± 3156; angur7/angur5: 50,930 ± 2877), elavC155/+; α-adaptin RNAi/+ (63,460 ± 3650), and the rescued animals (actin5C-GAL4/+;angur7/UAS-AP2σ, AP2σKG02457: 102,200 ± 6315) calculated by integrating quantal content over stimulus number in synaptic depression plot of Figure 6F until depletion was achieved. ***P < 0.0001. Numbers in the columns represent the number of animals used for experiments and quantification. The error bars represent standard error of the mean. Statistical analysis based on one-way ANOVA followed by post-hoc Tukey’s multiple-comparison test.
Figure 7
Figure 7
σ2-adaptin is required specifically for AP2 complex and clathrin stability. (A–E) Representative images of third instar larval boutons from control, heteroallelic σ2-adaptin mutant (angur7/AP2σKG02457), and transgene-rescued (actin5C/+; angur7/UAS-AP2σ, AP2σKG02457) NMJ synapses co-labeled with HRP (red) and other synaptic proteins (green): (A) α-adaptin; (B) β2-adaptin; (C); EYFP-Clc (D) Endophilin 1, and (E) Dynamin 1. The histograms on the right show quantification of these synaptic proteins in the boutons, expressed as percentage of control levels. The fluorescence intensity of at least 50 individual boutons was measured and the background subtracted for the quantification. ***P < 0.0001. Error bars represent standard error of the mean. Statistical analysis based on one-way ANOVA followed by post-hoc Tukey’s multiple-comparison test. (F) Western blot analysis of various synaptic proteins in larval brain of control, heteroallelic σ2-adaptin mutant (angur7/AP2σKG02457 and angur7/angur5), and rescued animals (actin5C/+; angur7/UAS-AP2σ, AP2σKG02457). Level of α-actin was used as loading control. The level of clathrin was assessed by probing the blots with anti-GFP antibody. For the EYFP-Clc experiment, the control genotype was elavC155/+; EYFP-Clc/+; the heteroallelic mutant genotype was elavC155/+; EYFP-Clc/+; angur7/AP2σKG02457; and the rescue genotype was elavC155/+; EYFP-Clc/+; angur7/UAS-AP2σ, AP2σKG02457.
Figure 8
Figure 8
Mutations in σ2-adaptin cause disruption of the presynaptic cytoskeleton and upregulated BMP signaling. (A–F) Representative images of third instar larval NMJs from (A and B) control animals, heteroallelic σ2-adaptin mutants (C and D) (angur7/AP2σKG02457), and transgene-rescued (E and F) (actin5C/+; angur7/UAS-AP2σ, AP2σKG02457) animals co-labeled with HRP (red) and 22C10 (green). (G) Histogram showing quantification of the percentage of boutons containing Futsch loops of the indicated genotypes. ***P < 0.0001. Error bars represent standard error of the mean. Statistical analysis based on one-way ANOVA followed by post-hoc Tukey’s multiple-comparison test. n = 6 NMJ synapses of muscles 6/7 of the A2 hemisegment. (H) Representative images of third instar larval boutons from (a) control, (b) heteroallelic σ2-adaptin mutant (angur7/AP2σKG02457), and (c) transgene-rescued (actin5C/+; angur7/UAS-AP2σ, AP2σKG02457) NMJ synapses co-labeled with HRP (red) and pMAD (green). (I) Histogram showing quantification of synaptic pMAD fluorescence of the indicated genotypes. The fluorescence intensity of at least 50 individual boutons was measured and the background subtracted for the quantification.***P < 0.0001. Error bars represent standard error of the mean. Statistical analysis based on one-way ANOVA followed by post-hoc Tukey’s multiple-comparison test. (J) Representative images of motor nuclei of third instar larval VNC from (a) control, (b) heteroallelic σ2-adaptin mutant (angur7/AP2σKG02457), and (c) transgene-rescued (actin5C/+; angur7/UAS-AP2σ, AP2σKG02457) animals co-labeled with Elav (red) and pMAD (green). (K) Histogram showing quantification of the nuclear pMAD fluorescence of the indicated genotypes. The fluorescence intensities of at least 50 motor nuclei were measured both for Elav and for pMAD, and the ratio of pMAD/elav represented in the quantification. ***P < 0.0001. Error bars represent standard error of the mean. Statistical analysis based on one-way ANOVA followed by post-hoc Tukey’s multiple-comparison test.

References

    1. Aberle H., Haghighi A. P., Fetter R. D., McCabe B. D., Magalhaes T. R., et al. , 2002. wishful thinking encodes a BMP type II receptor that regulates synaptic growth in Drosophila. Neuron 33: 545–558. - PubMed
    1. Boucrot E., Saffarian S., Zhang R., Kirchhausen T., 2010. Roles of AP-2 in clathrin-mediated endocytosis. PLoS One 5: e10597. - PMC - PubMed
    1. Brand A. H., Perrimon N., 1993. Targeted gene expression as a means of altering cell fates and generating dominant phenotypes. Development 118: 401–415. - PubMed
    1. Cheung G., Cousin M. A., 2012. Adaptor protein complexes 1 and 3 are essential for generation of synaptic vesicles from activity-dependent bulk endosomes. J. Neurosci. 32: 6014–6023. - PMC - PubMed
    1. Cheung G., Jupp O. J., Cousin M. A., 2010. Activity-dependent bulk endocytosis and clathrin-dependent endocytosis replenish specific synaptic vesicle pools in central nerve terminals. J. Neurosci. 30: 8151–8161. - PMC - PubMed

Publication types

MeSH terms

Substances

LinkOut - more resources