. 2016 Apr 15;291(16):8618-31.
doi: 10.1074/jbc.M115.698225. Epub 2016 Feb 26.

Naturally Occurring Isoleucyl-tRNA Synthetase without tRNA-dependent Pre-transfer Editing

Affiliations

Naturally Occurring Isoleucyl-tRNA Synthetase without tRNA-dependent Pre-transfer Editing

Nevena Cvetesic et al. J Biol Chem. .

Abstract

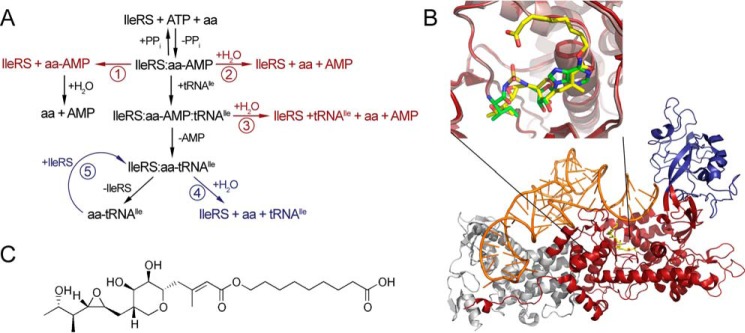
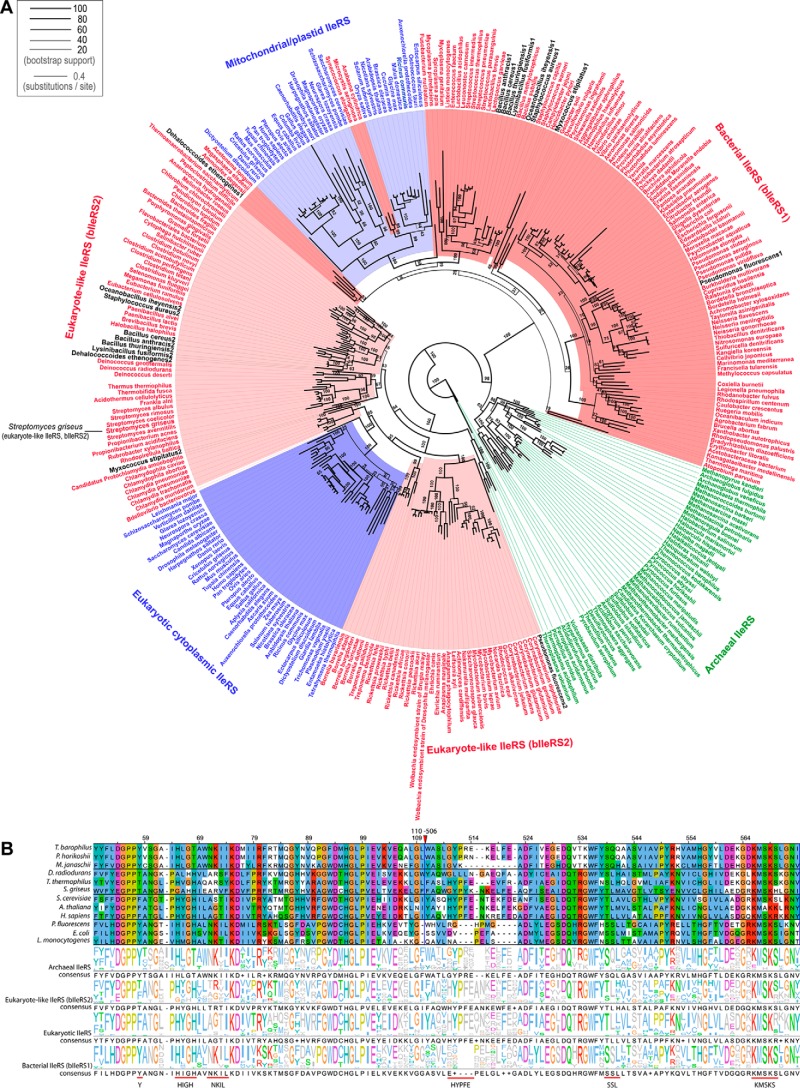
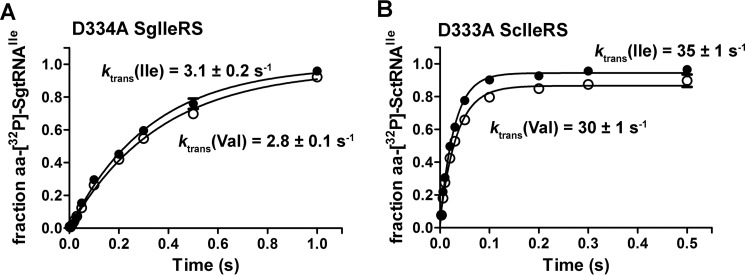
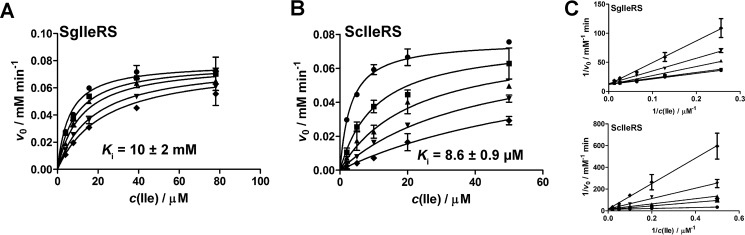
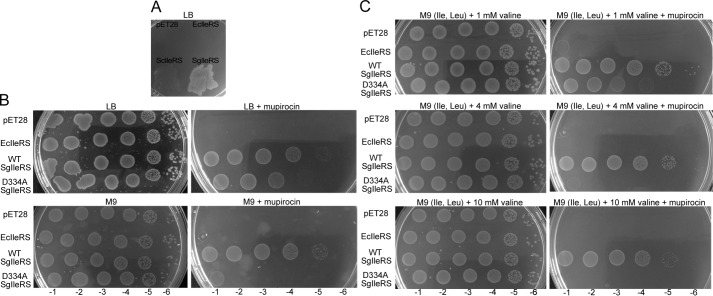
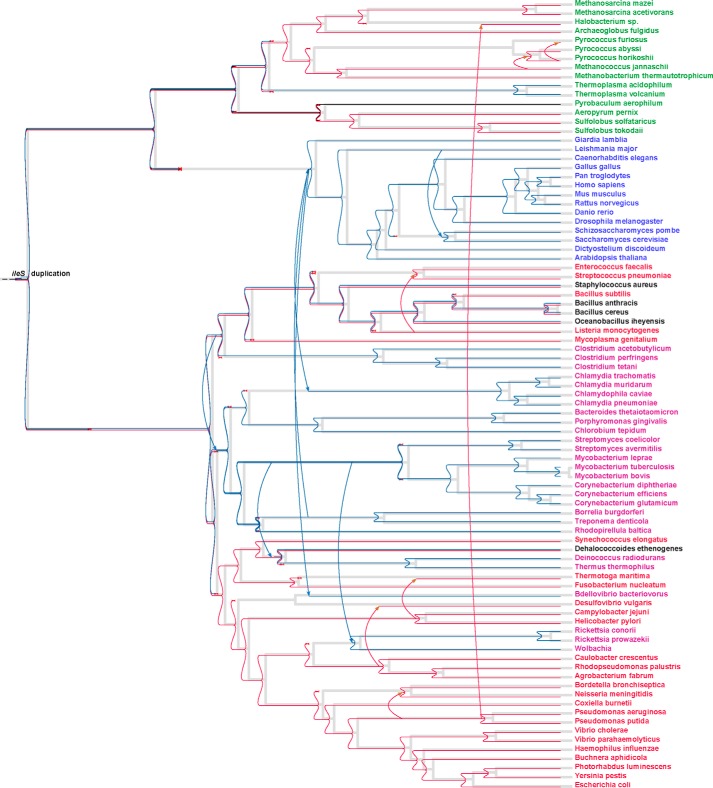
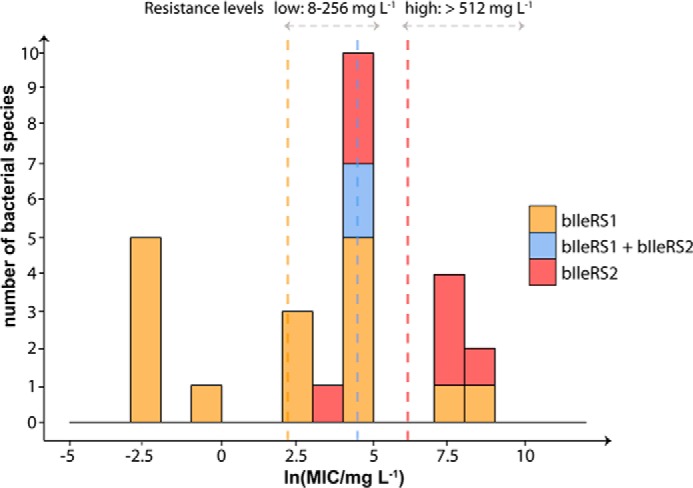
Isoleucyl-tRNA synthetase (IleRS) is unusual among aminoacyl-tRNA synthetases in having a tRNA-dependent pre-transfer editing activity. Alongside the typical bacterial IleRS (such as Escherichia coli IleRS), some bacteria also have the enzymes (eukaryote-like) that cluster with eukaryotic IleRSs and exhibit low sensitivity to the antibiotic mupirocin. Our phylogenetic analysis suggests that the ileS1 and ileS2 genes of contemporary bacteria are the descendants of genes that might have arisen by an ancient duplication event before the separation of bacteria and archaea. We present the analysis of evolutionary constraints of the synthetic and editing reactions in eukaryotic/eukaryote-like IleRSs, which share a common origin but diverged through adaptation to different cell environments. The enzyme from the yeast cytosol exhibits tRNA-dependent pre-transfer editing analogous to E. coli IleRS. This argues for the presence of this proofreading in the common ancestor of both IleRS types and an ancient origin of the synthetic site-based quality control step. Yet surprisingly, the eukaryote-like enzyme from Streptomyces griseus IleRS lacks this capacity; at the same time, its synthetic site displays the 10(3)-fold drop in sensitivity to antibiotic mupirocin relative to the yeast enzyme. The discovery that pre-transfer editing is optional in IleRSs lends support to the notion that the conserved post-transfer editing domain is the main checkpoint in these enzymes. We substantiated this by showing that under error-prone conditions S. griseus IleRS is able to rescue the growth of an E. coli lacking functional IleRS, providing the first evidence that tRNA-dependent pre-transfer editing in IleRS is not essential for cell viability.

Keywords: aminoacyl tRNA synthetase; antibiotic resistance; isoleucyl-tRNA synthetase; mupirocin; proofreading; protein evolution; protein synthesis; tRNA-dependent pre-transfer editing; transfer RNA (tRNA).


Figures

FIGURE 1.
FIGURE 1.
Structure of enzymatic pathway of IleRS. A, schematic presentation of enzymatic reactions. The central pathway, colored in black, represents amino acid activation, tRNA binding, aminoacyl transfer, and dissociation of aminoacylated tRNA from the enzyme. Editing pathways are shown to the left and right. Pre-transfer editing may proceed through enhanced dissociation of non-cognate aminoacyl-AMP (pathway 1) or through its enzymatic hydrolysis, which may be tRNA-independent (pathway 2) or tRNA-dependent (pathway 3). Misaminoacylated tRNA is deacylated through post-transfer editing, in cis (pathway 4) or in trans (pathway 5). Editing reactions occurring in synthetic site are colored in red, and the ones taking place in the editing domain are colored in blue. B, structure of S. aureus IleRS in complex with mupirocin and tRNAIle (Protein Data Bank code 1FFY). Synthetic domain is colored in red, editing domain in blue, tRNAIle in orange, and mupirocin in yellow. The inset shows overlapped structures T. thermophilus synthetic site with mupirocin in yellow (Protein Data Bank code 1JZS) and Ile-AMS in green (Protein Data Bank code 1JZQ). C, mupirocin structure.
FIGURE 2.
FIGURE 2.
IleRS phylogeny. A, IleRS phylogenetic tree. Bacterial species are colored red (species with eukaryote-like IleRS are shown in light red); archaea are green, and eukaryotes are blue (mitochondrial/plastid IleRS are shown in light blue). Species with both bacterial IleRS (bIleRS1) and eukaryote-like IleRS (bIleRS2) are shown in black. The line width of each branch is scaled according to the bootstrap support value (see legend), and the numbers along the branches show the percentage reproducibility of nodes in bootstrap replicates (some values were omitted for simplicity). The scale bar represents 0.4 estimated amino acid substitutions per site. B, partial amino acid sequence alignment of representative archaeal, eukaryote-like (bIleRS2), eukaryotic, and bacterial (bIleRS1) IleRSs. The presented regions include the consensus sequences HIGH and KMSKS and characteristic bacterial (Tyr-59; 71NKIL74; 572SSL, numbering according to EcIleRS) or eukaryotic/eukaryote-like motifs (541HYPFE, numbering according to ScIleRS). Each sequence logo was determined using the complete alignment with 334 sequences and represents the conservation within a certain IleRS group. The sequences were assigned to a group according to the phylogenetic analysis. The red triangle marks the omitted portion of the alignment.
FIGURE 3.
FIGURE 3.
Single-turnover transfer of isoleucine or valine by D334A SgIleRS (A) or D333A ScIleRS (B). Errors bars correspond to the S.E. from three independent experiments.
FIGURE 4.
FIGURE 4.
Inhibition of isoleucine activation by mupirocin in the reactions by SgIleRS or ScIleRS. A, activation by SgIleRS using 3.9, 7.8, 15.6, 39, and 78 μm isoleucine and 0 (●), 5 (■), 10 (▴), 20 (▾), and 30 mm (♦) mupirocin. B, activation by ScIleRS using 2 (●), 5 (■), 10 (▴), 20 (▾), and 50 μm (♦) isoleucine and 0, 20, 50, 100, and 200 μm mupirocin. The inhibition constants were determined by fitting the data to competitive inhibition model using GraphPad Prism. The values represent the best fit value ± S.E. of two independent experiments. C, Lineweaver-Burk plots depict a competitive inhibition pattern for both enzymes.
FIGURE 5.
FIGURE 5.
Complementation of E. coli growth in the presence of 100 μm mupirocin by expression of ScIleRS or SgIleRS in various conditions. In all experiments, the expression of ScIleRS, SgIleRS, or EcIleRS from pET28 plasmid was induced by 50 μm isopropyl 1-thio-β-d-galactopyranoside. A, complementation of E. coli growth on LB plates by expression of additional EcIleRS, ScIleRS, or SgIleRS. Semi-quantitative complementation drop-test of E. coli growth was performed by adding 100-μl decimal dilutions (−1 to −6) of each strain to the following plates. B, LB plates with or without mupirocin and M9 plates (no amino acids added) with or without mupirocin. C, M9 plates supplemented with 150 μm Ile, 150 μm Leu, and 1, 4, or 10 mm Val with or without mupirocin.
FIGURE 6.
FIGURE 6.
Most parsimonious reconciliation of the IleRS gene tree and the corresponding species tree. Species with bacterial IleRS (bIleRS1) are colored red; species with eukaryote-like IleRS are shown in purple; species with both bIleRS1 and bIleRS2 are shown in black; archaeal species are green, and eukaryotes are blue. The gray lines represent the species tree, and the colored lines represent evolutionary events associated with the gene tree as follows: horizontal lines denote speciation; arrows denote the most probable horizontal gene transfers that explain the occurrence of the IleRS type in a certain organism; red cross marks a loss of a gene; and a blue square (denoted also with ileS duplication) marks the duplication event. The red and blue colors mark the duplication event and further separation and speciation of bIleRS1 and bIleRS2, respectively.
FIGURE 7.
FIGURE 7.
Distribution of mupirocin MIC values for bacterial species. The MIC values were compiled from the literature (37, 41, 47, 56), and the corresponding IleRS type was assigned according to sequence similarity and phylogenetic analysis. The range of ln(MIC) values was divided into 12 bins (bin width equals 1 unit), and the number of species in each bin was plotted on the y axis. The overlapping columns are shown as stacked. The vertical lines represent the mean value for each group (line colors correspond to group colors). The levels of mupirocin resistance represent the literature values for acquired resistance in Staphylococcus species (59).

References

    1. Perona J. J., and Gruic-Sovulj I. (2014) Synthetic and editing mechanisms of aminoacyl-tRNA synthetases. Top. Curr. Chem. 344, 1–41 - PubMed
    1. Jakubowski H. (2012) Quality control in tRNA charging. Wiley Interdiscip. Rev. RNA 3, 295–310 - PubMed
    1. Dulic M., Cvetesic N., Perona J. J., and Gruic-Sovulj I. (2010) Partitioning of tRNA-dependent editing between pre- and post-transfer pathways in class I aminoacyl-tRNA synthetases. J. Biol. Chem. 285, 23799–23809 - PMC - PubMed
    1. Dulic M., Perona J. J., and Gruic-Sovulj I. (2014) Determinants for tRNA-dependent pretransfer editing in the synthetic site of isoleucyl-tRNA synthetase. Biochemistry 53, 6189–6198 - PMC - PubMed
    1. Nordin B. E., and Schimmel P. (2005) in Aminoacyl tRNA Synthetases (Ibba M., Francklyn C., and Cusack S., eds) pp. 24–35, Landes Biosciences, Georgetown, TX

Publication types

MeSH terms