

ETE 3: Reconstruction, Analysis, and Visualization of Phylogenomic Data
- PMID: 26921390
- PMCID: PMC4868116
- DOI: 10.1093/molbev/msw046
ETE 3: Reconstruction, Analysis, and Visualization of Phylogenomic Data
Abstract
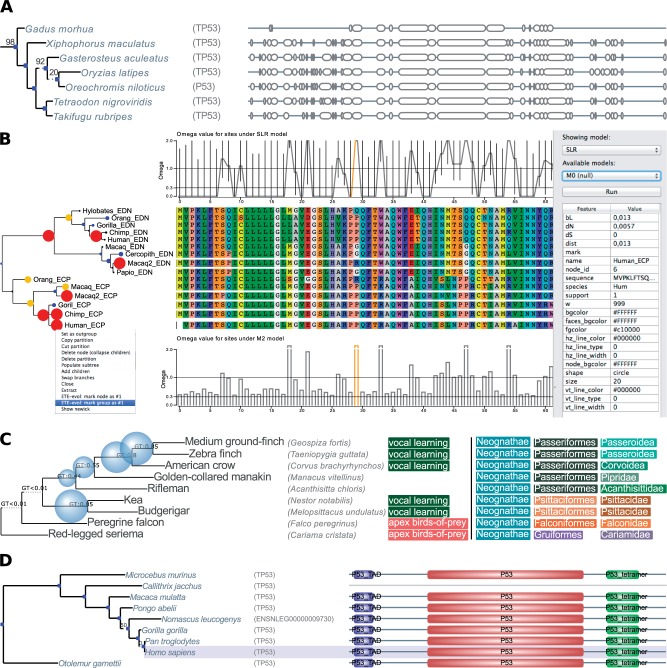
The Environment for Tree Exploration (ETE) is a computational framework that simplifies the reconstruction, analysis, and visualization of phylogenetic trees and multiple sequence alignments. Here, we present ETE v3, featuring numerous improvements in the underlying library of methods, and providing a novel set of standalone tools to perform common tasks in comparative genomics and phylogenetics. The new features include (i) building gene-based and supermatrix-based phylogenies using a single command, (ii) testing and visualizing evolutionary models, (iii) calculating distances between trees of different size or including duplications, and (iv) providing seamless integration with the NCBI taxonomy database. ETE is freely available at http://etetoolkit.org.
Keywords: NCBI taxonomy; hypothesis testing; phylogenetics.; phylogenomics; tree comparison; tree visualization.
© The Author 2016. Published by Oxford University Press on behalf of the Society for Molecular Biology and Evolution.
Figures
References
-
- Bielawski JP, Yang Z. 2004. A maximum likelihood method for detecting functional divergence at individual codon sites, with application to gene family evolution. J. Mol. Evol. 59:121–132. - PubMed
-
- Chiapello H, Mallet L, Guérin C, Aguileta G, Amselem J, Kroj T, Ortega-Abboud E, Lebrun M-H, Henrissat B, Gendrault A, et al. 2015. Deciphering genome content and evolutionary relationships of isolates from the fungus magnaporthe oryzae attacking different host plants. Genome. Biol. Evol. 7:2896–2912. - PMC - PubMed
-
- Derelle R, Lang BF. 2012. Rooting the eukaryotic tree with mitochondrial and bacterial proteins. Mol. Biol. Evol. 29:1277–1289. - PubMed
Publication types
MeSH terms
LinkOut - more resources
Full Text Sources
Other Literature Sources
