. 2016 Apr 25:248:1-8.
doi: 10.1016/j.toxlet.2016.02.012. Epub 2016 Feb 24.

Morphologic effects of estrogen stimulation on 3D MCF-7 microtissues

Affiliations

Morphologic effects of estrogen stimulation on 3D MCF-7 microtissues

Marguerite M Vantangoli et al. Toxicol Lett. .

Abstract

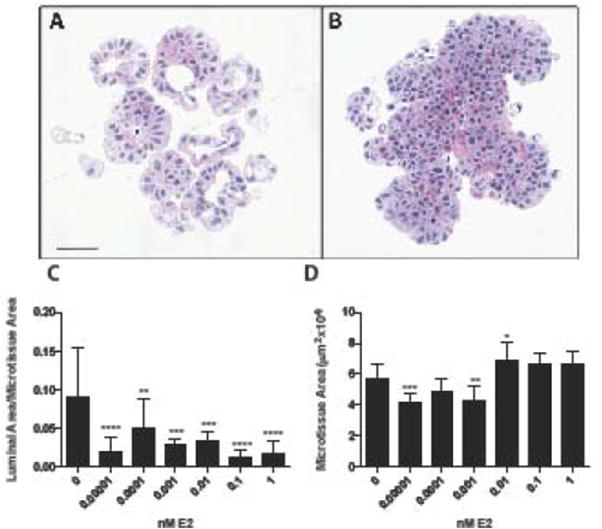
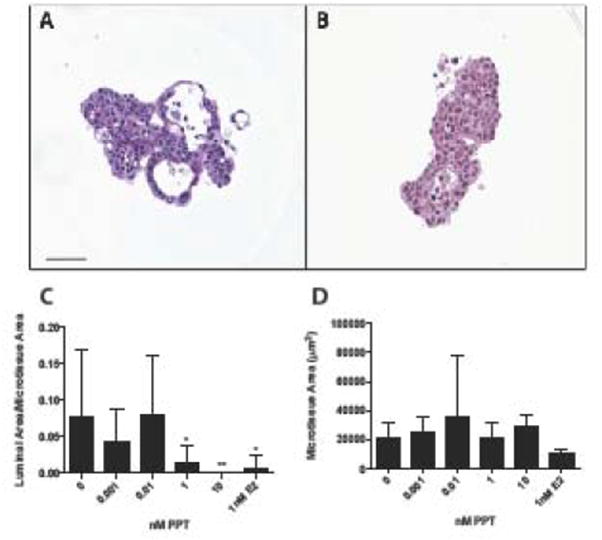
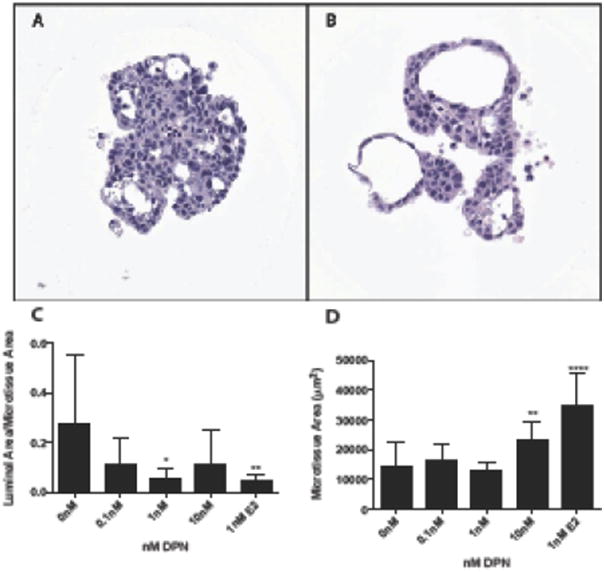
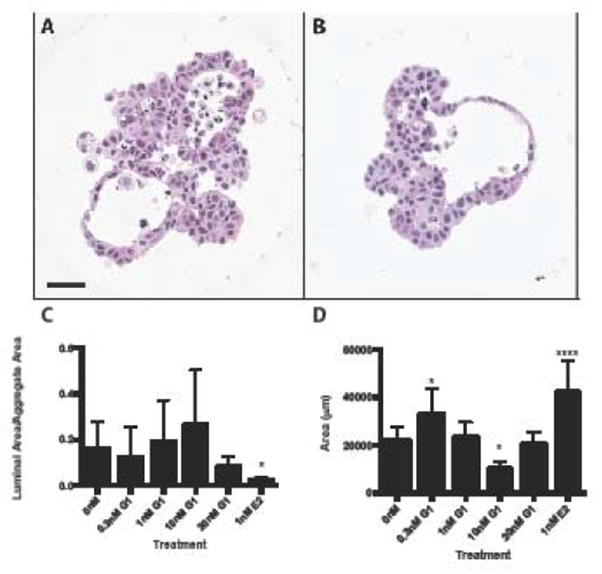
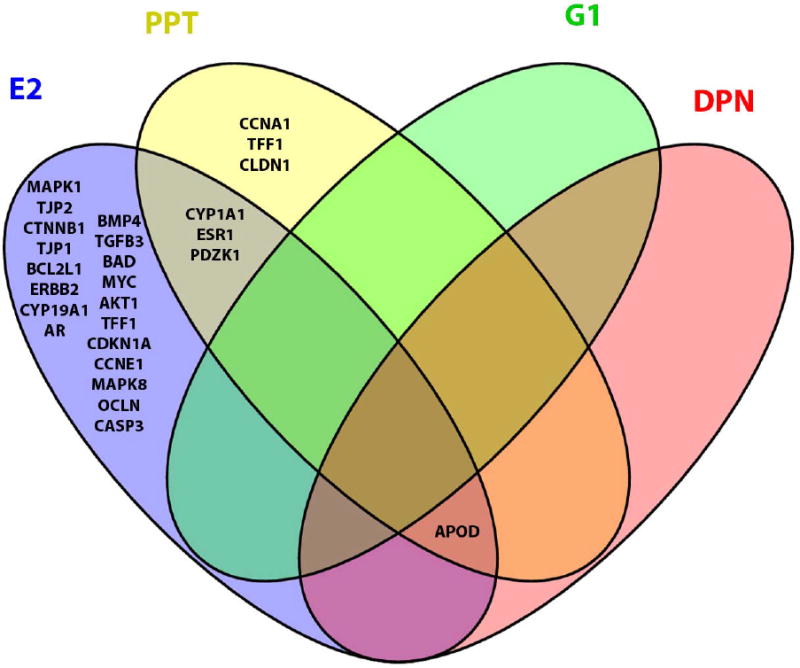
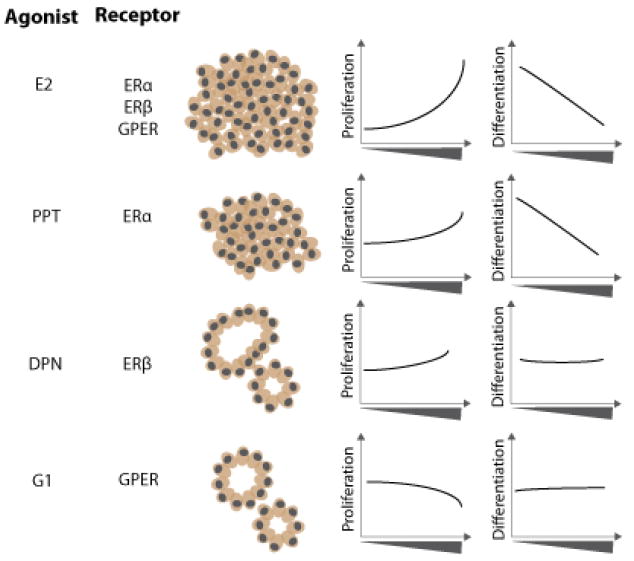
In the development of human cell-based assays, 3-dimensional (3D) cell culture models are intriguing as they are able to bridge the gap between animal models and traditional two-dimensional (2D) cell culture. Previous work has demonstrated that MCF-7 human breast carcinoma cells cultured in a 3D scaffold-free culture system self-assemble and develop into differentiated microtissues that possess a luminal space. Exposure to estradiol for 7 days decreased lumen formation in MCF-7 microtissues, altered microtissue morphology and altered expression of genes involved in estrogen signaling, cell adhesion and cell cycle regulation. Exposure to receptor-specific agonists for estrogen receptor alpha, estrogen receptor beta and g-protein coupled estrogen receptor resulted in unique, receptor-specific phenotypes and gene expression signatures. The use of a differentiated scaffold-free 3D culture system offers a unique opportunity to study the phenotypic and molecular changes associated with exposure to estrogenic compounds.

Keywords: Estrogens; In vitro assays; Morphology; Morphometrics; Three-dimensional models.


Conflict of interest statement

Conflict of Interest: Kim Boekelheide is an occasional expert consultant for chemical and pharmaceutical companies, and owns stock in Semma Therapeutics, a biotechnology company developing a cell-based therapy for diabetes.

Figures

Figure 1
Figure 1
E2 treatment alters MCF-7 microtissue morphology. Histology of MCF-7 microtissues grown for 7 days in vehicle control (A) or 1nM estradiol (B)demonstrated distinct morphological differences resulting from treatment. MCF-7 microtissues exhibited decreased lumen formation, represented as luminal area/aggregate area in a concentration-dependent manner (C), and resulted in slight changes in microtissue area (D). Morphologic data is shown as mean ± SEM, and were analyzed using one-way ANOVA. Scale bar = 50μm. * p<0.05, ** p<0.01, *** p<0.001, ****p<0.0001
Figure 2
Figure 2
Selective estrogen receptor alpha activation by PPT disrupts MCF-7 microtissue morphology. Representative histological sections of 3D MCF-7 microtissues grown in vehicle control (A) or 5nM PPT (B) for 7 days. PPT treatment reduced the luminal formation within MCF-7 microtissues (C), and did not alter microtissue area (D). Data is displayed as mean ± SEM, with analysis using a one-way ANOVA. Scale bar = 50μm. * p<0.05, **p<0.01
Figure 3
Figure 3
Estrogen receptor beta activation with DPN alters MCF-7 microtissue morphology at high concentrations. MCF-7 microtissues were grown for 7 days in the presence of vehicle control (A) or 5nM DPN (B). DPN treatment significantly reduced the luminal ratio at 1nM, while 10nM DPN treatment significantly increased cellular area. Data is represented as mean ± SEM, and was analyzed using one-way ANOVA. Scale bar = 50μm. * p<0.05, ** p<0.01, *** p<0.001, ****p<0.0001
Figure 4
Figure 4
Activation of g-protein coupled estrogen receptor does not significantly alter MCF-7 microtissue morphology. MCF-7 microtissues were grown in the presence of vehicle control (A) or 0.3nM G1 (B) for 7 days. G1 treatment did not significantly alter MCF-7 luminal morphology (C). At 0.3nM G1, microtissue area was significantly increased, while at 10nM microtissue area was signiifcantly decreased (D). Morphologic data is shown as mean ± SEM, and were analyzed using one-way ANOVA. Scale bar = 50μm. * p<0.05, ** p<0.01, *** p<0.001, ****p<0.0001
Figure 5
Figure 5
Selective estrogen receptor activation results in unique gene expression profiles. E2 (blue) altered expression of 19 unique transcripts, PPT (yellow) altered expression of 3 transcripts and G1 (green) resulted in altered expression of 1 transcript. G1 treatment did not share any significantly differentially expressed genes with any other treatments, however, E2, DPN and PPT shared expression of 1 transcript, while E2 and PPT shared 3 transcripts.
Figure 6
Figure 6
Selective receptor activation resulted in unique MCF-7 microtissue morphology. E2 treatment, which activated ERα, ERβ and GPER caused a concentration-dependent increase in proliferation and decrease in differentiation (luminal ratio). Selective activation of ERα using PPT resulted in a concentration-dependent increase in proliferation and decrease in microtissue differentiation. Activation of ERβ using the selective agonist DPN resulted in a significant increase in proliferation at high concentrations and no change in differentiation. GPER activation with G1 resulted in a decrease in proliferation at high concentrations, with no changes in differentiation.

References

    1. Krewski D, Acosta D, Andersen M, Anderson H, Bailar JC, Boekelheide K, et al. Toxicity testing in the 21st century: a vision and a strategy. Journal of Toxicology and Environmental Health, Part B. 2010;13(2-4):51–138. - PMC - PubMed
    1. Gudjonsson T, Ronnov-Jessen L, Villadsen R, Rank F, Bissell MJ, Petersen OW. Normal and tumor-derived myoepithelial cells differ in their ability to interact with luminal breast epithelial cells for polarity and basement membrane deposition. Journal of cell science. 2002;115(Pt 1):39–50. Epub 2002/01/22. - PMC - PubMed
    1. Kenny PA, Lee GY, Myers CA, Neve RM, Semeiks JR, Spellman PT, et al. The morphologies of breast cancer cell lines in three-dimensional assays correlate with their profiles of gene expression. Molecular oncology. 2007;1(1):84–96. doi: 10.1016/j.molonc.2007.02.004. Epub 2008/06/03. - DOI - PMC - PubMed
    1. Lee GY, Kenny PA, Lee EH, Bissell MJ. Three-dimensional culture models of normal and malignant breast epithelial cells. Nature methods. 2007;4(4):359–65. doi: 10.1038/nmeth1015. Epub 2007/03/31. - DOI - PMC - PubMed
    1. Streuli CH, Bailey N, Bissell MJ. Control of mammary epithelial differentiation: basement membrane induces tissue-specific gene expression in the absence of cell-cell interaction and morphological polarity. The Journal of cell biology. 1991;115(5):1383–95. Epub 1991/12/01. - PMC - PubMed

Publication types