

Translational mixed-effects PKPD modelling of recombinant human growth hormone - from hypophysectomized rat to patients
- PMID: 26921845
- PMCID: PMC4867743
- DOI: 10.1111/bph.13473
Translational mixed-effects PKPD modelling of recombinant human growth hormone - from hypophysectomized rat to patients
Abstract
Background and purpose: We aimed to develop a mechanistic mixed-effects pharmacokinetic (PK)-pharmacodynamic (PD) (PKPD) model for recombinant human growth hormone (rhGH) in hypophysectomized rats and to predict the human PKPD relationship.
Experimental approach: A non-linear mixed-effects model was developed from experimental PKPD studies of rhGH and effects of long-term treatment as measured by insulin-like growth factor 1 (IGF-1) and bodyweight gain in rats. Modelled parameter values were scaled to human values using the allometric approach with fixed exponents for PKs and unscaled for PDs and validated through simulations relative to patient data.
Key results: The final model described rhGH PK as a two compartmental model with parallel linear and non-linear elimination terms, parallel first-order absorption with a total s.c. bioavailability of 87% in rats. Induction of IGF-1 was described by an indirect response model with stimulation of kin and related to rhGH exposure through an Emax relationship. Increase in bodyweight was directly linked to individual concentrations of IGF-1 by a linear relation. The scaled model provided robust predictions of human systemic PK of rhGH, but exposure following s.c. administration was over predicted. After correction of the human s.c. absorption model, the induction model for IGF-1 well described the human PKPD data.
Conclusions: A translational mechanistic PKPD model for rhGH was successfully developed from experimental rat data. The model links a clinically relevant biomarker, IGF-1, to a primary clinical end-point, growth/bodyweight gain. Scaling of the model parameters provided robust predictions of the human PKPD in growth hormone-deficient patients including variability.
© 2016 The British Pharmacological Society.
Figures
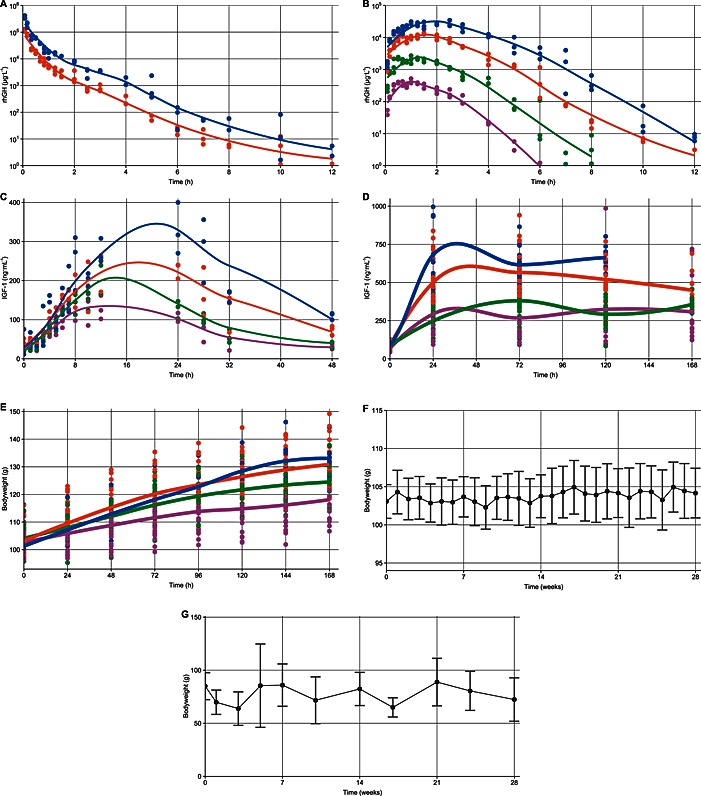
 ), 221 μg (
 ), 1106 μg (
 ) and 3319 μg (
 ) rhGH absolute (PD studies) or per 100 g bodyweight (PKPD study).
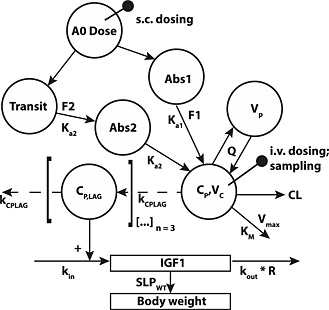
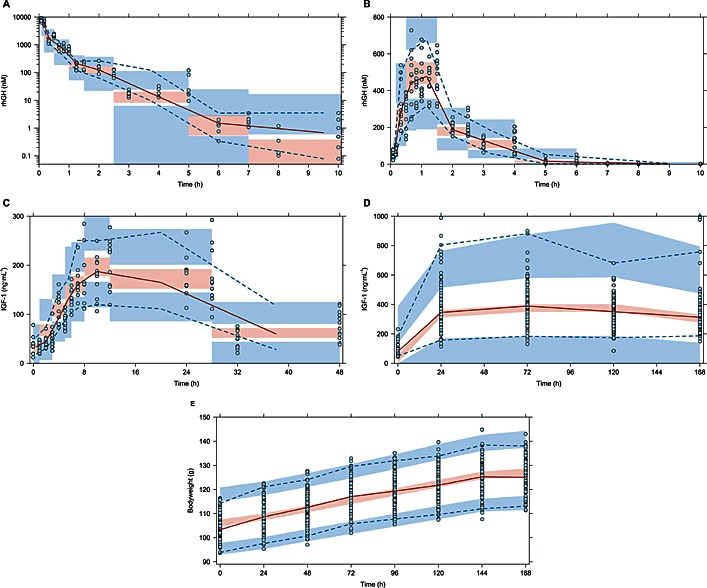
 ) represent observed data, the (
 ) represents the median of the observed data and the (
 ) represent the median of the 2.5 % and 97.5 % outer observations. The (
 ) represents a simulation‐based 95% confidence interval for the median; while the (
 ) represent a simulation‐based 95% confidence interval for the 2.5 % and 97.5 % model‐predicted percentiles.
 ) represent observed data, the () represents the median of the observed data and the () represent the median of the 2.5 % and 97.5 % outer observations. The () represents a simulation‐based 95% confidence interval for the median; while the () represent a simulation‐based 95% confidence interval for the 2.5 % and 97.5 % model‐predicted percentiles.
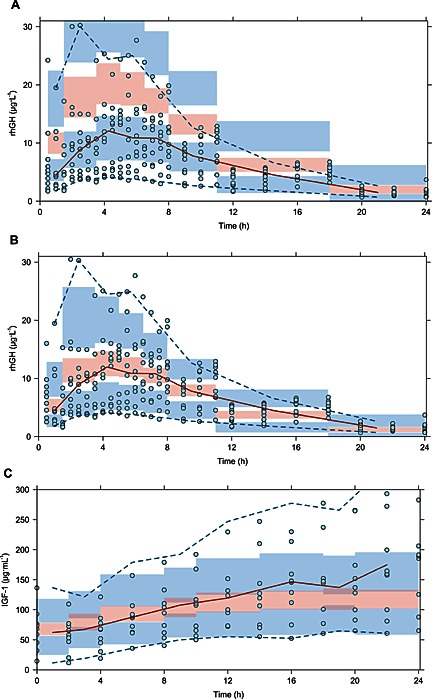 ) represent observed data, the () represents the median of the observed data and the () represent the median of the 2.5 % and 97.5 % outer observations. The () represents a simulation‐based 95% confidence interval for the median; while the () represent a simulation‐based 95% confidence interval for the 2.5 % and 97.5 % model‐predicted percentiles.
Similar articles
-
Differential long-term effects of insulin-like growth factor-I (IGF-I) growth hormone (GH), and IGF-I plus GH on body growth and IGF binding proteins in hypophysectomized rats.Endocrinology. 1996 May;137(5):1913-20. doi: 10.1210/endo.137.5.8612531. Endocrinology. 1996. PMID: 8612531
-
A pharmacokinetic/pharmacodynamic model for recombinant human growth hormone effects on induction of insulin-like growth factor I in monkeys.J Pharmacol Exp Ther. 1999 Jun;289(3):1523-32. J Pharmacol Exp Ther. 1999. PMID: 10336548
-
The effect of polyethylene glycol recombinant human growth hormone on growth and glucose metabolism in hypophysectomized rats.Growth Horm IGF Res. 2012 Feb;22(1):30-5. doi: 10.1016/j.ghir.2011.12.002. Epub 2012 Jan 16. Growth Horm IGF Res. 2012. PMID: 22257554
-
Growth promotion by insulin-like growth factor I in hypophysectomized and diabetic rats.Mol Cell Endocrinol. 1998 May 25;140(1-2):143-9. doi: 10.1016/s0303-7207(98)00042-2. Mol Cell Endocrinol. 1998. PMID: 9722182 Review.
-
Pharmacokinetic/pharmacodynamic modelling approaches in paediatric infectious diseases and immunology.Adv Drug Deliv Rev. 2014 Jun;73(100):127-39. doi: 10.1016/j.addr.2014.01.002. Epub 2014 Jan 17. Adv Drug Deliv Rev. 2014. PMID: 24440429 Free PMC article. Review.
Cited by
-
Guidance for the treatment of adult growth hormone deficiency with somapacitan, a long-acting growth hormone preparation.Front Endocrinol (Lausanne). 2022 Dec 23;13:1040046. doi: 10.3389/fendo.2022.1040046. eCollection 2022. Front Endocrinol (Lausanne). 2022. PMID: 36619571 Free PMC article. Review.
-
Tissue Distribution and Receptor Activation by Somapacitan, a Long Acting Growth Hormone Derivative.Int J Mol Sci. 2020 Feb 11;21(4):1181. doi: 10.3390/ijms21041181. Int J Mol Sci. 2020. PMID: 32053994 Free PMC article.
-
Effect of Kidney or Hepatic Impairment on the Pharmacokinetics and Pharmacodynamics of Somapacitan: Two Open-Label, Parallel-Group Trials.Clin Pharmacokinet. 2021 Aug;60(8):1015-1027. doi: 10.1007/s40262-021-00990-7. Epub 2021 Mar 23. Clin Pharmacokinet. 2021. PMID: 33754315 Free PMC article. Clinical Trial.
-
Towards a Göttingen minipig model of adult onset growth hormone deficiency: evaluation of stereotactic electrocoagulation method.Heliyon. 2019 Nov 28;5(11):e02892. doi: 10.1016/j.heliyon.2019.e02892. eCollection 2019 Nov. Heliyon. 2019. PMID: 31844758 Free PMC article.
-
Reaction Kinetic Models of Antibiotic Heteroresistance.Int J Mol Sci. 2019 Aug 15;20(16):3965. doi: 10.3390/ijms20163965. Int J Mol Sci. 2019. PMID: 31443146 Free PMC article.
References
-
- Boxenbaum H (1982). Interspecies scaling, allometry, physiological time, and the ground plan of pharmacokinetics. J Pharmacokinet Biopharm 10: 201–227. - PubMed
-
- Cleton A, de Greef HJMM, Edelbroek PM, Voskuyl RA, Danhof M (1999). Application of a combined "effect compartment/indirect response model" to the central nervous system effects of tiagabine in the rat. J Pharmacokinet Biopharm 27: 301–323. - PubMed
Publication types
MeSH terms
Substances
LinkOut - more resources
Full Text Sources
Other Literature Sources
Miscellaneous
