. 2016 Jun;22(6):507-17.
doi: 10.1111/cns.12525. Epub 2016 Feb 28.

MiR-150 Regulates Poststroke Cerebral Angiogenesis via Vascular Endothelial Growth Factor in Rats

Affiliations

MiR-150 Regulates Poststroke Cerebral Angiogenesis via Vascular Endothelial Growth Factor in Rats

Quan-Wei He et al. CNS Neurosci Ther. 2016 Jun.

Abstract

Aims: Angiogenesis is a harmonized target for poststroke recovery. Therefore, exploring the mechanisms involved in angiogenesis after stroke is vitally significant. In this study, we are reporting a miR-150-based mechanism underlying cerebral poststroke angiogenesis.

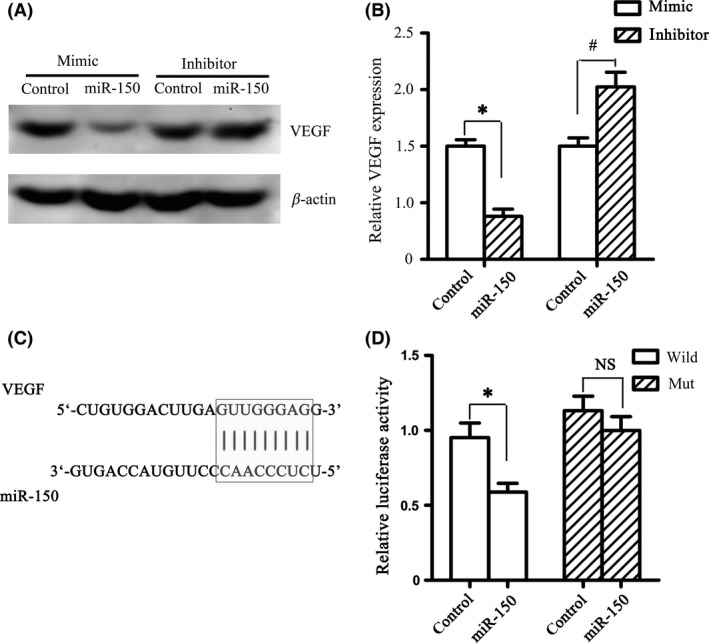
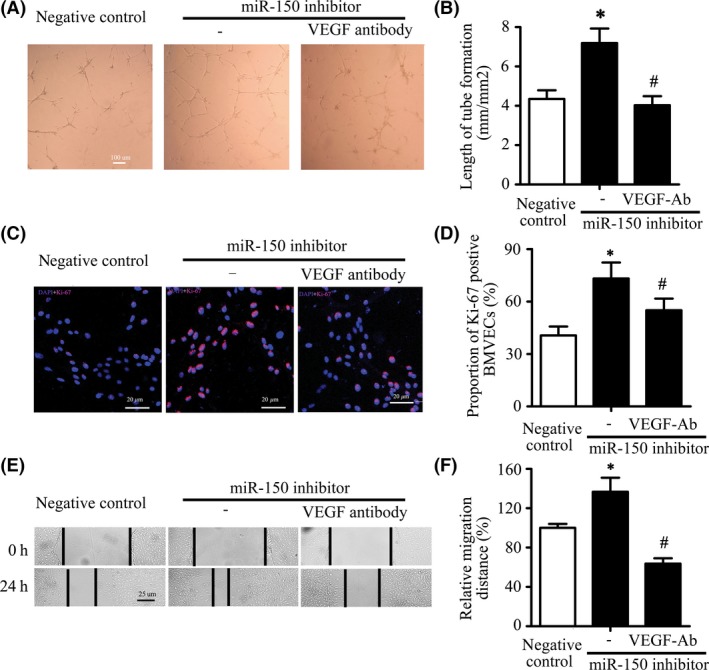
Methods: Rat models of middle cerebral artery occlusion (MCAO) and cell models of oxygen-glucose deprivation were conducted. Capillary density, tube formation, cell proliferation, and cell migration were measured by FITC-dextran assay, matrigel assay, Ki-67 staining, and wound healing assay, respectively. The expression of miR-150 and vascular endothelial growth factor (VEGF) was, respectively, measured by RT-PCR and Western blotting. Dual-luciferase assay was conducted to confirm the binding sites between miR-150 and VEGF.

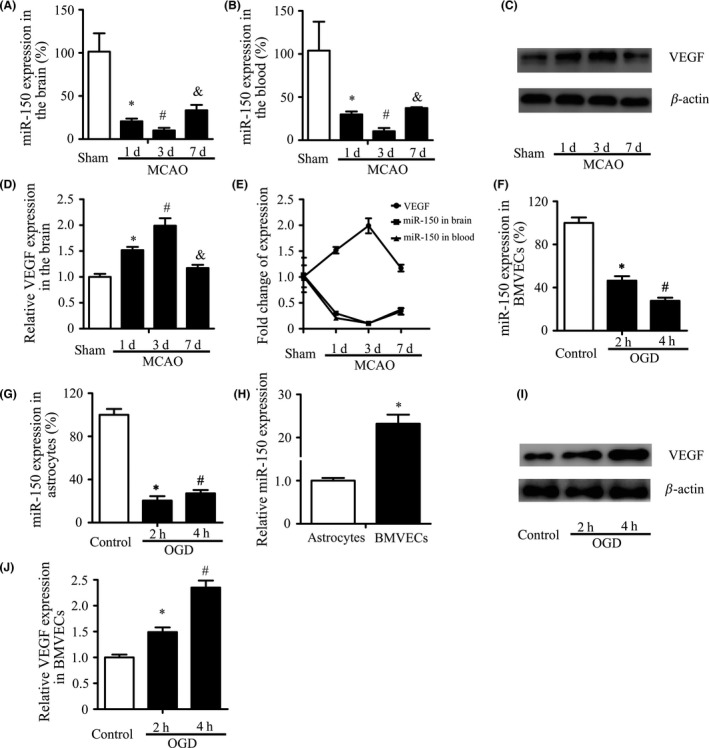
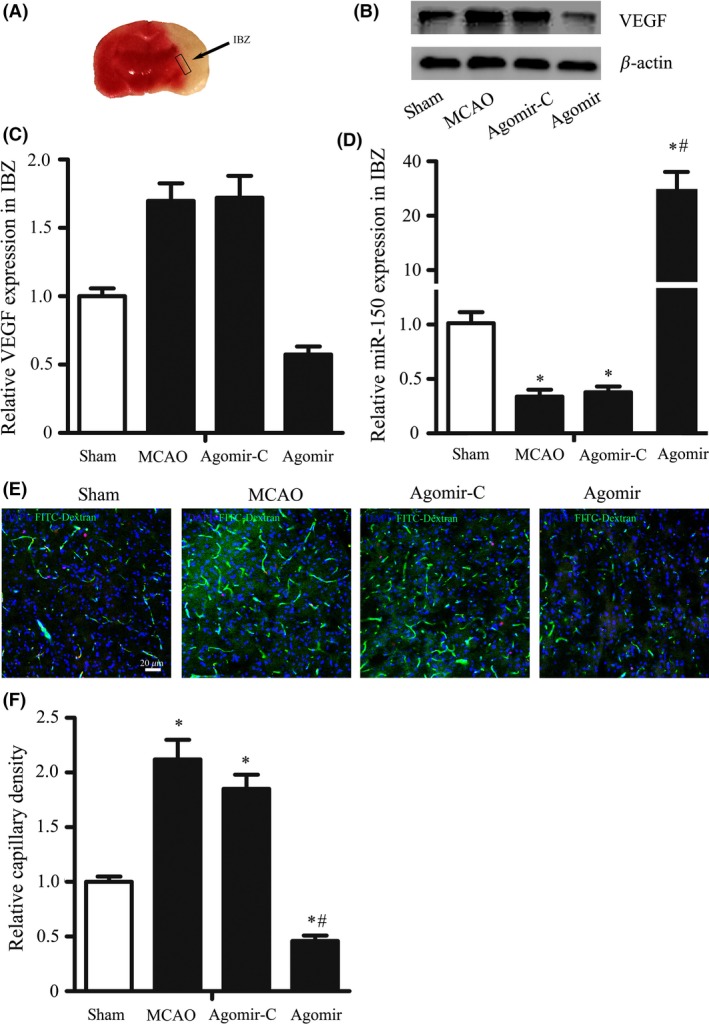
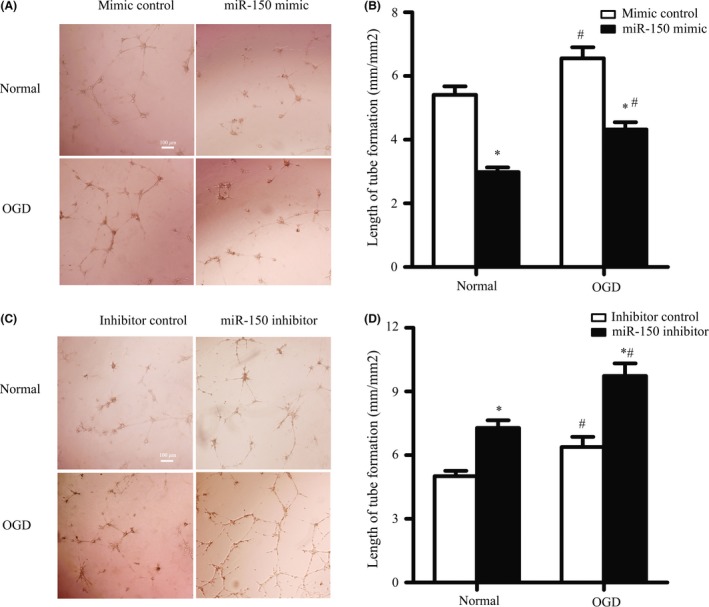
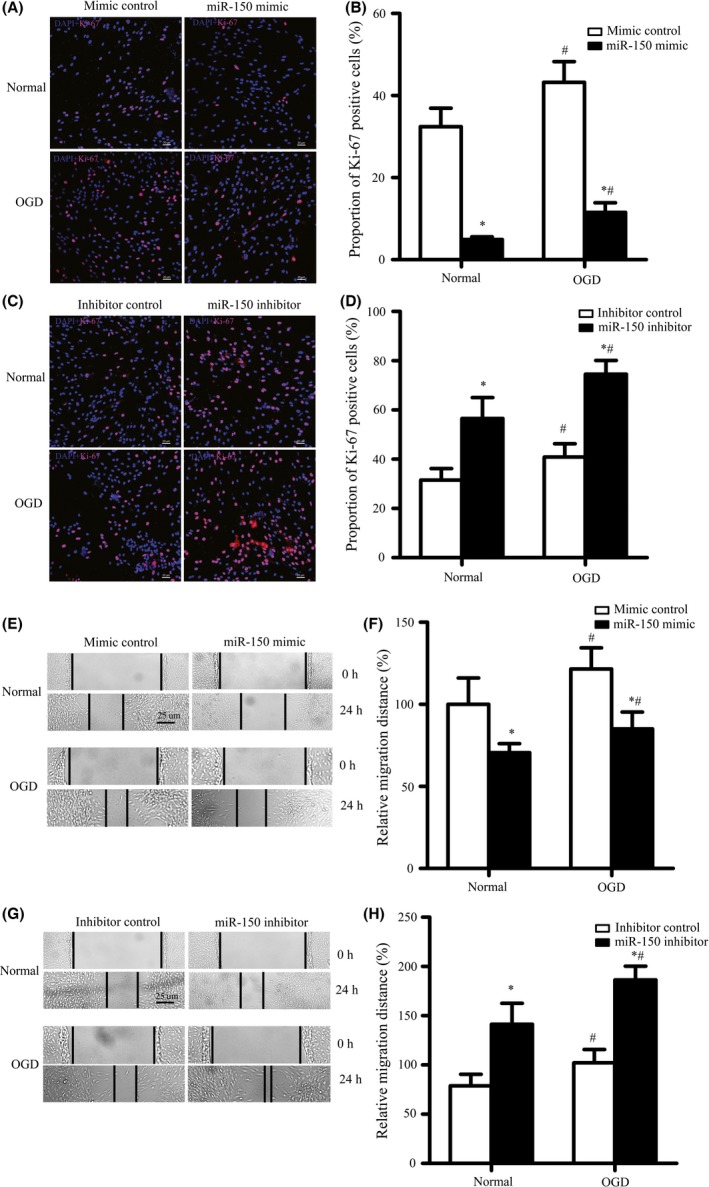
Results: We found that miR-150 expression in the brain and serum of rats subjected to cerebral ischemia, and in oxygen-glucose-deprived brain microvascular endothelial cells (BMVECs) and astrocytes. Upregulation of miR-150 expression could decrease vascular density of infarct border zone in rat after MCAO and decrease tube formation, proliferation, and migration of BMVECs. We also found that miR-150 could negatively regulate the expression of VEGF, and VEGF was confirmed to be a direct target of miR-150. Moreover, VEGF mediated the function of miR-150 on tube formation, proliferation, and migration of BMVECs.

Conclusions: Our data suggested that miR-150 could regulate cerebral poststroke angiogenesis in rats through VEGF.

Keywords: Angiogenesis; Brain microvascular endothelial cells; Stroke; Vascular endothelial growth factor; miR-150.


Conflict of interest statement

The authors declare no conflict of interest.

Figures

Figure 1
Figure 1
MiR‐150 is Downregulated after Ischemia. (AB) MiR‐150 expression decreased significantly following ischemia in brain and blood. Sprague Dawley rats were randomly assigned to four groups (sham, 1, 3, 7 days after MCAO), n = 5. U6 and miR‐16 were used as the internal control, respectively, and data of miR‐150 expression in the brain were normalized by those of the contralateral side. Data were related to the sham group and showed as mean ± standard deviation (SD). *P < 0.05 vs. the sham control, # P < 0.05 vs. 1 day, & P < 0.05 vs. 3 day. (CE) The expression of VEGF protein in the ischemic border zone (IBZ) was increased following ischemia and negatively related to miR‐150. β‐Actin was used as the internal control. Data were related to the sham group and showed as mean ± standard deviation (SD). *P < 0.05 vs. the sham control, # P < 0.05 vs. 1 day, & P < 0.05 vs. 3 day. (FG) The expression of miR‐150 in BMVECs and astrocytes decreased significantly. Brain microvascular endothelial cells (BMVECs) and astrocytes were treated with oxygen–glucose deprivation (OGD) for 2, 4 h. U6 was used as the internal control. *P < 0.05 vs. the control, # P < 0.05 vs.2 h. (H) MiR‐150 expression in BMVECs was much higher than in astrocytes. U6 was used as the internal control. *P < 0.05. (IJ) The expression of VEGF protein in BMVECs was increased significantly after OGD. β‐Actin was used as the internal control. *P < 0.05 vs. the control, # P < 0.05 vs. 2 h.
Figure 2
Figure 2
MiR‐150 Controls Cerebral Angiogenesis after MCAO in Rats. Rats were randomly assigned to 4 groups: sham, n = 8, MCAO, n = 6, agomir control (agomir‐C), n = 7, and miR‐150 agomir, n = 5. (A) Representative IBZ was showed, where the brain sample was obtained on the 7th following MCAO. (BC) MiR‐150 agomir reversed the increase of VEGF protein expression in the IBZ following MCAO. β‐Actin was used as the internal control.*P < 0.05, vs. sham group, # P < 0.05 vs. agomir control group. (D) MiR‐150 agomir increased the expression of miR‐150 in IBZ after MCAO. MiR‐150 was detected by RTPCR, and U6 was used as the internal control. (EF) MiR‐150 agomir reversed the increase of capillary density in IBZ following MCAO. (E) The representative pictures of immunofluorescence staining of frozen sections taken from the IBZ were shown (blue for DAPI, pink for Ki‐67, and green for FITC‐dextran, FITC). Bar = 20 μm. 2F the results showed that capillary density in IBZ was significantly increased after MCAO, while miR‐150 agomir reversed this change after MCAO. *P < 0.05 vs. sham groups, # P < 0.05 vs. agomir control group.
Figure 3
Figure 3
MiR‐150 Regulates BMVECs Capillary‐like Tube Formation. (AB) miR‐150 mimic inhibited the capillary‐like tube formation in brain microvascular endothelial cells (BMVECs) in normal condition and oxygen–glucose deprivation (OGD) condition. BMVECs were transfected by miR‐150 mimic or mimic control, and the length of capillary‐like tube structure was measured. Bar = 100 μm. *P < 0.05 vs. the control group, # P < 0.05 vs. the normal group. (CD) MiR‐150 inhibitor promoted the capillary‐like tube formation in BMVECs in normal condition and OGD condition. BMVECs were transfected by miR‐150 mimic or mimic control, and the length of capillary‐like tube structure was measured. Bar = 100 μm. *P < 0.05 vs. the control group, # P < 0.05 vs. the normal group.
Figure 4
Figure 4
MiR‐150 Regulates BMVECs Proliferation and Migration. (AD) MiR‐150 mimic decreased the proportion of Ki‐67‐positive staining BMVECs in normal condition and oxygen–glucose deprivation (OGD) condition (AB), while miR‐150 inhibitor increased the proportion of Ki‐67‐positive staining BMVECs in normal condition and OGD condition (4CD). *P < 0.05 vs. the control group, # P < 0.05 vs. the normal group. The representative pictures of immunofluorescence (pink for Ki‐67, blue for DAPI) were shown. Bar = 20 μm. *P < 0.05 vs. the control group. (EH) MiR‐150 mimic decreased the distance of BMVECs migration in normal condition and OGD condition (4E‐F), while miR‐150 inhibitor increased it. (GH) The representative pictures of the scratch tests were captured and the distance of migration was quantified. Bar = 25 μm. *P < 0.05 vs. the control group, # P < 0.05 vs. the normal group.
Figure 5
Figure 5
MiR‐150 Directly Regulates the Expression of VEGF. (AB) MiR‐150 mimic decreased VEGF protein expression in BMVECs, while miR‐150 inhibitor increased VEGF protein expression. The protein expression of VEGF after 24‐h transfection was detected by Western blot. *P < 0.05 vs. mimic control group, # P < 0.05 vs. inhibitor control group. (C) Bioinformatic analysis showed that complementary regions were identified in the 3′‐UTR of VEGF. (D) By dual‐luciferase assay, VEGF was recognized as the direct target of miR‐150. The ratio of luciferase activity of each type was calculated either in the presence or absence of exogenous miR‐150. *P < 0.05 vs. control group in cotransfected with pmiR‐VEGF‐wt, while no significant difference (NS) in cotransfected with pmiR‐VEGF‐mut.
Figure 6
Figure 6
VEGF Mediated the Increase of BMVECs Capillary‐like Tube Formation, Proliferation, and Migration by MiR‐150 Inhibitor. (AB) VEGF‐neutralizing antibody significantly reversed miR‐150 downregulation induced increase of capillary‐like tube formation. The representative pictures of tube formation were shown, and the length of tube formation was measured. Bar = 100 μm. *P < 0.05 vs. the inhibitor control group, # P < 0.05 vs. the miR‐150 inhibitor. (CD) VEGF‐neutralizing antibody significantly reversed miR‐150 downregulation induced increase of Ki‐67‐positive staining proportion of BMVECs. Pink for Ki‐67, blue for DAPI, Bar = 20 μm. *P < 0.05 vs. the inhibitor control group, # P < 0.05 vs. the miR‐150 inhibitor. (EF) VEGF‐neutralizing antibody significantly reversed miR‐150 downregulation induced increase of migration distance of BMVECs. Bar = 25 μm. *P < 0.05 vs. the inhibitor control group, # P < 0.05 vs. the miR‐150 inhibitor.

References

    1. Ferrara N, Kerbel RS. Angiogenesis as a therapeutic target. Nature 2005;438:967–974. - PubMed
    1. Wang J, Shi Y, Zhang L, et al. Omega‐3 polyunsaturated fatty acids enhance cerebral angiogenesis and provide long‐term protection after stroke. Neurobiol Dis 2014;68:91–103. - PMC - PubMed
    1. Giacca M, Zacchigna S. VEGF gene therapy: therapeutic angiogenesis in the clinic and beyond. Gene Ther 2012;19:622–629. - PubMed
    1. He QW, Xia YP, Chen SC, et al. Astrocyte‐derived sonic hedgehog contributes to angiogenesis in brain microvascular endothelial cells via RhoA/ROCK pathway after oxygen‐glucose deprivation. Mol Neurobiol 2013;47:976–987. - PubMed
    1. Xia YP, He QW, Li YN, et al. Recombinant human sonic hedgehog protein regulates the expression of ZO‐1 and occludin by activating angiopoietin‐1 in stroke damage. PLoS One 2013;8:e68891. - PMC - PubMed

Publication types

MeSH terms