. 2017 Mar;77(3):1307-1317.
doi: 10.1002/mrm.26185. Epub 2016 Feb 28.

A new paramagnetically shifted imaging probe for MRI

Affiliations

A new paramagnetically shifted imaging probe for MRI

P Kanthi Senanayake et al. Magn Reson Med. 2017 Mar.

Abstract

Purpose: To develop and characterize a new paramagnetic contrast agent for molecular imaging by MRI.

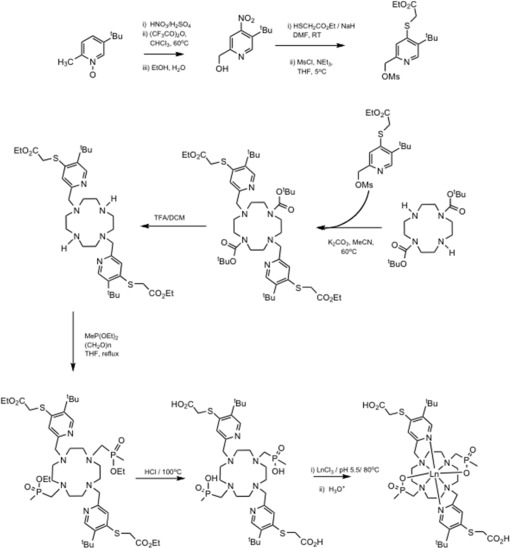
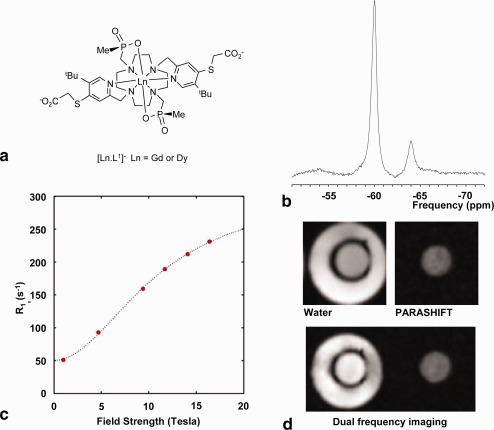
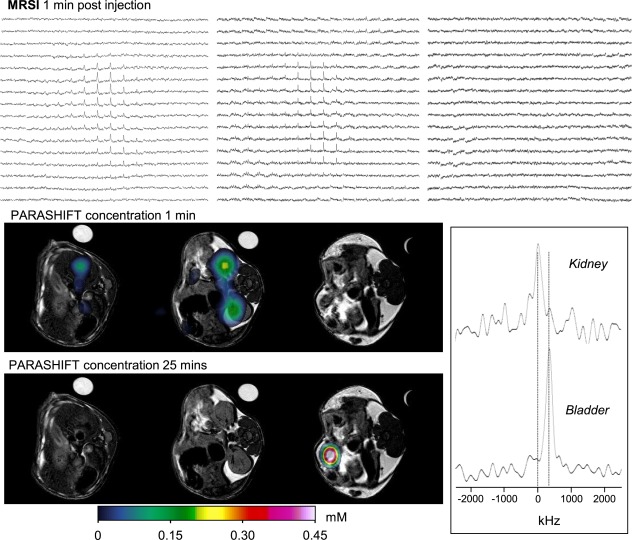
Methods: A contrast agent was developed for direct MRI detection through the paramagnetically shifted proton magnetic resonances of two chemically equivalent tert-butyl reporter groups within a dysprosium(III) complex. The complex was characterized in phantoms and imaged in physiologically intact mice at 7 Tesla (T) using three-dimensional (3D) gradient echo and spectroscopic imaging (MRSI) sequences to measure spatial distribution and signal frequency.

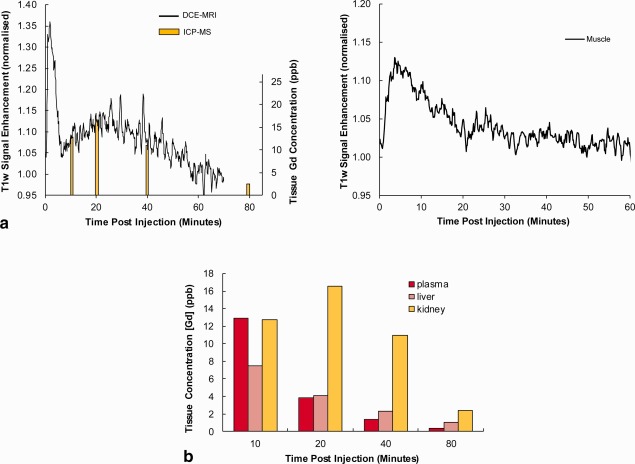
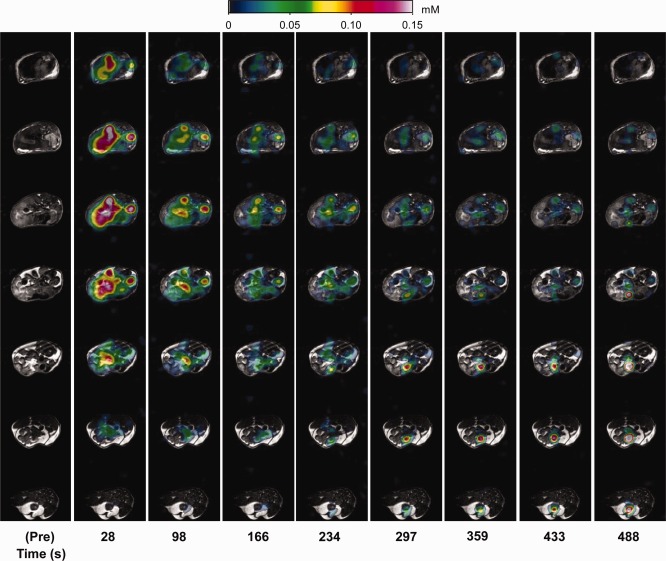
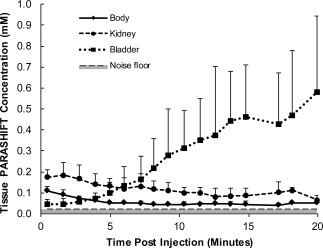
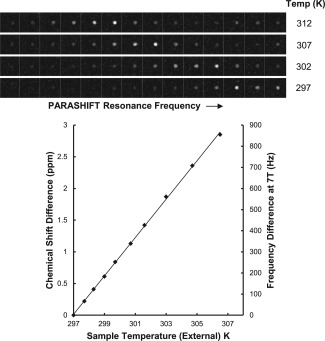
Results: The reporter protons reside ∼6.5 Å from the paramagnetic center, resulting in fast T1 relaxation (T1 = 8 ms) and a large paramagnetic frequency shift exceeding 60 ppm. Fast relaxation allowed short scan repetition times with high excitation flip angle, resulting in high sensitivity. The large dipolar shift allowed direct frequency selective excitation and acquisition of the dysprosium(III) complex, independent of the tissue water signal. The biokinetics of the complex were followed in vivo with a temporal resolution of 62 s following a single, low-dose intravenous injection. The lower concentration limit for detection was ∼23 μM. Through MRSI, the temperature dependence of the paramagnetic shift (0.28 ppm.K-1 ) was exploited to examine tissue temperature variation.

Conclusions: These data demonstrate a new MRI agent with the potential for physiological monitoring by MRI. Magn Reson Med 77:1307-1317, 2017. © 2016 The Authors Magnetic Resonance in Medicine published by Wiley Periodicals, Inc. on behalf of International Society for Magnetic Resonance in Medicine. This is an open access article under the terms of the Creative Commons Attribution License, which permits use, distribution and reproduction in any medium, provided the original work is properly cited.

Keywords: contrast agent; molecular imaging; paramagnetic shift; temperature mapping.


Figures

Figure 1
Figure 1
Synthesis scheme for the [Ln.L1] complexes, in which Ln was either Gd or Dy.
Figure 2
Figure 2
Structure and properties of the PARASHIFT complex. (a) Structure of [Ln.L1]. (b) Proton spectrum collected on a 7T preclinical imaging scanner from the tert‐butyl signal region (centered at 60.1 ppm) for [Dy.L1]. The signal was measured from 100 μL of 6 mM solution using a volume imaging coil, with a 1‐ms‐long Gaussian 90° excitation pulse, 20‐kHz spectral width, TR = 55 ms, 32 averages, and a total acquisition time of 1.76 s. The long RF pulse was used to narrow the bandwidth and prevented excitation of water, but led to a first‐order phase difference between the major and minor resonances. The major resonance at 60.1 ppm yields 88% of the signal, with the minor resonance at 63.8 ppm the remaining 12% signal. (c) Longitudinal relaxation rates for [Dy.L1] as a function of magnetic field, (D2O 295 K) showing the fit (line) of the Solomon‐Morgan‐Bloembergen equation to the data (fixed r = 6.5 Å; τ r = 334 ps; T 1E = 0.41 ps; μ eff = 10.6 B.M.). (d) Axial images from a 3DGE acquisition in a concentric tube phantom containing 3 mM [Dy.L1] solution in the central tube and water only in the outer tube. Upper row of the panel shows the water (left) and [Dy.L1] (right) images using frequency‐selective excitation of each resonance. Lower row of panel shows dual imaging acquisition using double bandwidth readout and Gaussian signal excitation optimized at the [Dy.L1] frequency. Residual flip angle at the water frequency (20‐KHz offset) yields the water image.
Figure 3
Figure 3
Biodynamics of [Gd.L1] in vivo. (a) MRI signal intensity curves obtained from selected ROIs using a DCE‐MRI sequence. (b) Measurements of tissue Gd concentration based on invasive tissue sampling. The kidney data (yellow) are shown overlaid onto the DCE‐MRI signal curve (a, left) to illustrate the similarity in time course (despite being in different animals).
Figure 4
Figure 4
PARASHIFT measurements in vivo. PARASHIFT signal from [Dy.L1] (color scale) overlaid onto conventional structural MRI scans. Each column represents a different time point post injection. Within each column the data represent different spatial axial slices through the mouse. Mean peak ROI signal to noise ratio in this animal was 9.9 in liver, 11.7 in kidney, and 18.6 in bladder.
Figure 5
Figure 5
Time series analysis of PARASHIFT concentration from selected ROIs in six mice.
Figure 6
Figure 6
In vitro PARASHIFT temperature mapping studies. Each image row presents data collected using a 2D spectroscopic imaging acquisition at the specified sample temperature. Chemical shift separation between each image is 0.52 ppm. The spectral data were reconstructed as images of PARASHIFT peak intensity at each spectral frequency, and dependence of shift on temperature is plotted. The upper image rows (T = 307 K and 312 K) span both the major and minor isomers and demonstrate that these peaks shift in parallel; therefore, the presence of the minor isomer does not confound temperature measurement using the major isomer.
Figure 7
Figure 7
In vivo PARASHIFT dual imaging experiment showing contrast agent distribution as a function of time and tissue temperature assessment based on the frequency dependence of the PARASHIFT signal. Data were collected using a 3DSI sequence providing a four‐dimensional data set (three spatial and one spectral). The image panel presents the spectral grids for three of the MRSI slices acquired 1 min after intravenous injection (upper row), with the same data displayed as the reconstructed PARASHIFT tissue distribution (derived from the peak area for each voxel in the 3DSI experiment) overlaid on the anatomical scans (middle row). The tissue concentration data at 25 min post injection are shown in the bottom row. The anatomical scans were collected before contrast injection and show the location of the PARASHIFT filled tube used for system calibration and as a concentration reference. This sample tube was withdrawn remotely from the FOV before injection and therefore does not appear in the PARASHIFT images. PARASHIFT frequency is temperature‐dependent and can be used to map temperature differences. Spectra (lower right panel) were extracted from selected regions of interest in kidney at the 1‐min time point and from the bladder at the 25‐min time point and corrected for differences in Bo field strength in each region based on the water signal frequency. Significant changes in signal frequency (temperature) are apparent over time between the kidney and bladder.

References

    1. Caravan P, Ellison JJ, McMurry TJ, Lauffer RB. Gadolinium(III) chelates as MRI contrast agents: structure, dynamics, and applications. Chem Rev 1999;99:2293–2352. - PubMed
    1. Chen HH, Wei L, Rotile NJ, Farrar CT, Tanabe KK, Fuchs BC, Caravan P. Quantitative molecular magnetic resonance imaging (MRI) of lysyl oxidase‐mediated collagen crosslinking during liver fibrosis. Hepatology 2014;60:205A.
    1. Fuchs BC, Wang H, Yang Y, et al. Molecular MRI of collagen to diagnose and stage liver fibrosis. J Hepatol 2013;59:992–998. - PMC - PubMed
    1. Caravan P, Yang Y, Zachariah R, Schmitt A, Mino‐Kenudson M, Chen HH, Sosnovik DE, Dai G, Fuchs BC, Lanuti M. Molecular magnetic resonance imaging of pulmonary fibrosis in mice. Am J Resp Cell Mol Biol 2013;49:1120–1126. - PMC - PubMed
    1. Sibson NR, Blamire AM, Bernades‐Silva M, Laurent S, Boutry S, Muller RN, Styles P, Anthony DC. MRI detection of early endothelial activation in brain inflammation. Magn Reson Med 2004;51:248–252. - PubMed

Publication types

MeSH terms