. 2016 Feb 29:7:10562.
doi: 10.1038/ncomms10562.

Increased generation of Foxp3(+) regulatory T cells by manipulating antigen presentation in the thymus

Affiliations

Increased generation of Foxp3(+) regulatory T cells by manipulating antigen presentation in the thymus

Jiqiang Lin et al. Nat Commun. .

Abstract

Regulatory T-cell (Treg) selection in the thymus is essential to prevent autoimmune diseases. Although important rules for Treg selection have been established, there is controversy regarding the degree of self-reactivity displayed by T-cell receptors expressed by Treg cells. In this study we have developed a model of autoimmune skin inflammation, to determine key parameters in the generation of skin-reactive Treg cells in the thymus (tTreg). tTreg development is predominantly AIRE dependent, with an AIRE-independent component. Without the knowledge of antigen recognized by skin-reactive Treg cells, we are able to enhance skin-specific tTreg cell generation using three approaches. First, we increase medullary thymic epithelial cells by using mice lacking osteoprotegerin or by adding TRANCE (RANKL, Tnfsf11). Second, we inject intrathymically peripheral dendritic cells from skin-draining sites. Finally, we inject skin tissue lysates intrathymically. These findings have implications for enhancing the generation of organ-specific Treg cells in autoimmune diseases.


Figures
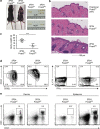
Figure 1
Figure 1. 2P24 Treg TCR recognizes an antigen expressed in the skin.
(a) Focal alopecia and enlarged skin-draining lymph node (LN) in 2-month-old 2P24 Foxp3sfy mice. (b) Haematoxylin and eosin (H&E) staining of skin from 2-month-old WT mice, 2P24 Foxp3wt and 2P24 Foxp3sfy mice. (c) Body weight of 2-month-old 2P24 Foxp3wt and 2P24 Foxp3sfy littermate mice. (d) CD44, CD62L, interferon (IFN)-γ and IL-17A expression in CD4+ T cells from skin-draining LN of 2P24 Foxp3wt and 2P24 Foxp3sfy mice. (e) Lymphocyte infiltration in dermis and epidermis of 2P24 Foxp3wt and 2P24 Foxp3sfy mice. Data are representative of two independent experiments with three to five mice per group. Statistics were performed with unpaired Student's t-test. Error bars represent s.e.m. P-values >0.05: nonsignificant (NS); ***P-values ≤0.001: significant.
Figure 2
Figure 2. AIRE-dependent and -independent development of Treg cells.
(a) Top row, three panels: CD45.2 2P24 BM cells were transferred into lethally irradiated CD45.1 Aire+/− or Aire−/− recipients. Eight weeks later, thymi were analysed by flow cytometry. Left two panels: representative staining of CD45.2+CD4SP cells; right panel: Treg numbers per total thymi. Results are summary of three independent experiments. Middle row three panels: same as top row three panels but using BM cells from CD45.2 A12 mice. Results are summary of three independent experiments. Bottom row, three panels: 2P24 crossed to Aire−/− mice. Left two panels: representative staining of CD4SP cells from thymi of 2-month-old mice; right panel: Treg number per total thymi. Results are summary of three independent experiments. (b) 2P24 Foxp3wt BM cells or 2P24 Foxp3sfy BM cells were transferred into sublethally irradiated Rag1−/− Aire+/− or Rag1−/− Aire−/− recipients. Shown are haematoxylin and eosin (H&E) staining of the skin from recipients 10 weeks after transfer. Data are representative of two independent experiments with three to four mice per group. Statistics were performed with unpaired Student's t-test. Error bars represent s.e.m. P-values >0.05: nonsignificant (NS); *P-values ≤0.05: significant; **P-values ≤0.01: significant; ***P-values ≤0.001: significant.
Figure 3
Figure 3. Bona fide AIRE-independent 2P24 thymic Treg generation.
(a) Top: Scheme of kidney capsule transplantation experiments. Bottom left panel: picture of a kidney with three separate thymic lobes. Bottom right panel: Treg cell numbers per total thymic lobes. Results are representative of three independent experiments. (b) FTOC. E16 2P24 thymi (Aire+/+, Aire+/− and Aire−/−) were cultured in tranwell plates for 7 days. Left three panels: representative staining of gated CD4SP cells. Right panel: Treg cell numbers per total cultured thymic lobes. Results are summary of two independent experiments. (c) Top: scheme of intrathymic injections; 0.1 million CD45.1 DC from the spleen or skin-draining LN (sLN) were injected into CD45.2 thymi. Middle row: recovery of injected cells, as shown by CD45.1 staining of total live cells. Bottom row: Treg staining gated on recipient CD45.2+CD4SP cells. Right panel: Treg cell numbers per total thymi. Results are summary of three independent experiments. Statistics in a were performed with paired Student's t-test and statistics in b,c were performed with unpaired Student's t-test. Error bars represent s.e.m. P-values >0.05: nonsignificant (NS); *P-values ≤0.05: significant; **P-values ≤0.01: significant; **P-values ≤0.001: significant.
Figure 4
Figure 4. 2P24 Treg selection requires haematopoietic APC.
(a) Scheme of mismatched BM chimeras. Mice in both groups were treated with anti-NK1.1 antibody for the first 3 weeks after transfer. Representative thymus staining was gated on CD4SP cells. (b) BM chimeras were created in the same way as in a, with the inclusion of Aire−/− recipient groups. Summary of Treg cell numbers in the BM chimeras. Results are the summary of three independent experiments. Statistics were performed with unpaired Student's t-test. Error bars represent s.e.m. P-values >0.05: nonsignificant (NS); *P-values ≤0.05: significant; **P-values ≤0.01: significant.
Figure 5
Figure 5. Increasing mTEC dramatically increases Treg selection.
(a) Polyclonal Opg+/− and Opg−/−mice. Top two panels: representative flow cytometry of CD4SP gated cells. Bottom two panels: Treg cell percentages and numbers. Results are the summary of two independent experiments. (b) 2P24 Opg+/− and Opg−/−mice. Top two panels: representative flow cytometry of CD4SP gated cells. Bottom two panels: Treg cell percentages and numbers. Results are the summary of two independent experiments. (c) A12 Opg+/− and Opg−/−mice. Top two panels: representative flow cytometry of CD4SP gated cells. Bottom two panels: Treg cell percentages and numbers. Results are the summary of two independent experiments. (d) Treg cell numbers in 2P24 Opg+ Aire+, Opg+ Aire−/−, Opg−/− Aire+ and Opg−/− Aire−/− mice. Results are the summary of three independent experiments. Statistics were performed with unpaired Student's t-test. Error bars represent s.e.m. P-values >0.05: nonsignificant (NS); **P-values ≤0.01: significant; ***P-values ≤0.001: significant.
Figure 6
Figure 6. Skin extracts injected intrathymically boost 2P24 Tregs.
(a) Single cells prepared from the indicated organs of H-2u WT mice were sonicated for 5 min. The total extracts (including the soluble part and the debris) were intrathymically injected into 2P24 Aire−/− mice. Each mouse received an equivalent of one million cells. Three days later, the recipients' thymi were analysed by flow cytometry. Shown is the Treg numbers per total thymi. Results are the summary of five independent experiments. (b) Epidermal extracts were injected intrathymically into 2P24 Aire+ mice in the same way as in a. Shown is Treg numbers per total thymi 3 days after the injection. Results are the summary of three independent experiments. (c) The same epidermal extracts were injected intrathymically into A12 Aire+ mice in the same way as in a. Shown is Treg numbers per total thymi 3 days after the injection. Results are the summary of two independent experiments. Statistics were performed with unpaired Student's t-test. Error bars represent s.e.m. P-values >0.05: nonsignificant (NS); *P-values ≤0.05: significant; **P-values ≤0.01: significant; ***P-values ≤0.001: significant.

Similar articles

Cited by

References

    1. Sakaguchi S., Yamaguchi T., Nomura T. & Ono M. Regulatory T cells and immune tolerance. Cell 133, 775–787 (2008). - PubMed
    1. Josefowicz S. Z., Lu L. F. & Rudensky A. Y. Regulatory T cells: mechanisms of differentiation and function. Annu. Rev. Immunol. 30, 531–564 (2012). - PMC - PubMed
    1. Bilate A. M. & Lafaille J. J. Induced CD4+Foxp3+ regulatory T cells in immune tolerance. Annu. Rev. Immunol. 30, 733–758 (2012). - PubMed
    1. Lafaille J. J., Nagashima K., Katsuki M. & Tonegawa S. High incidence of spontaneous autoimmune encephalomyelitis in immunodeficient anti-myelin basic protein T cell receptor transgenic mice. Cell 78, 399–408 (1994). - PubMed
    1. Curotto de Lafaille M. A. et al. Hyper immunoglobulin E response in mice with monoclonal populations of B and T lymphocytes. J. Exp. Med. 194, 1349–1359 (2001). - PMC - PubMed

Publication types

MeSH terms