. 2016 Apr:265:177-87.
doi: 10.1016/j.jmr.2016.01.019. Epub 2016 Feb 4.

Dual-pathway multi-echo sequence for simultaneous frequency and T2 mapping

Affiliations

Dual-pathway multi-echo sequence for simultaneous frequency and T2 mapping

Cheng-Chieh Cheng et al. J Magn Reson. 2016 Apr.

Abstract

Purpose: To present a dual-pathway multi-echo steady state sequence and reconstruction algorithm to capture T2, T2(∗) and field map information.

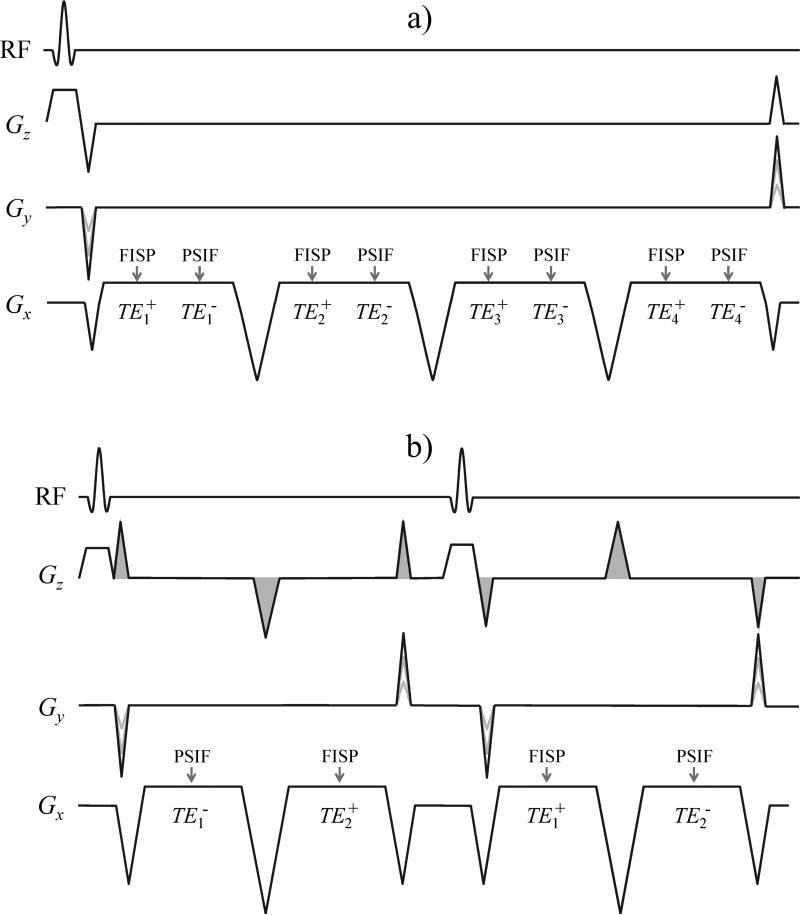
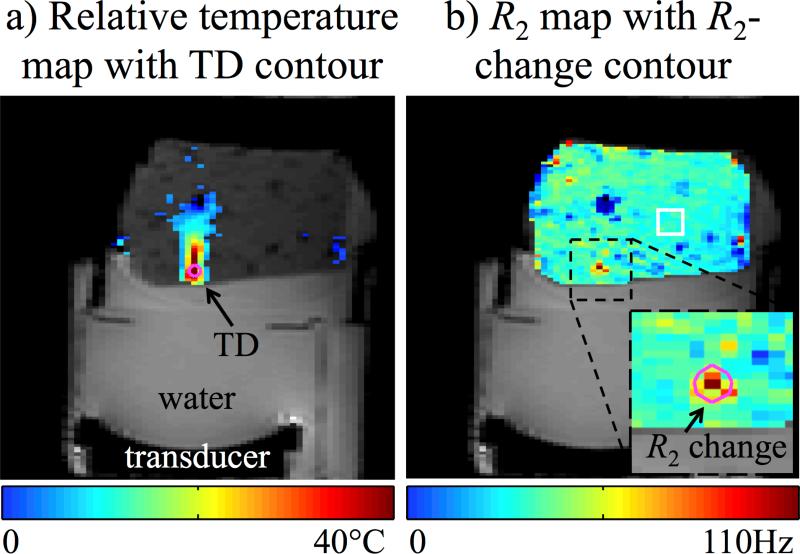
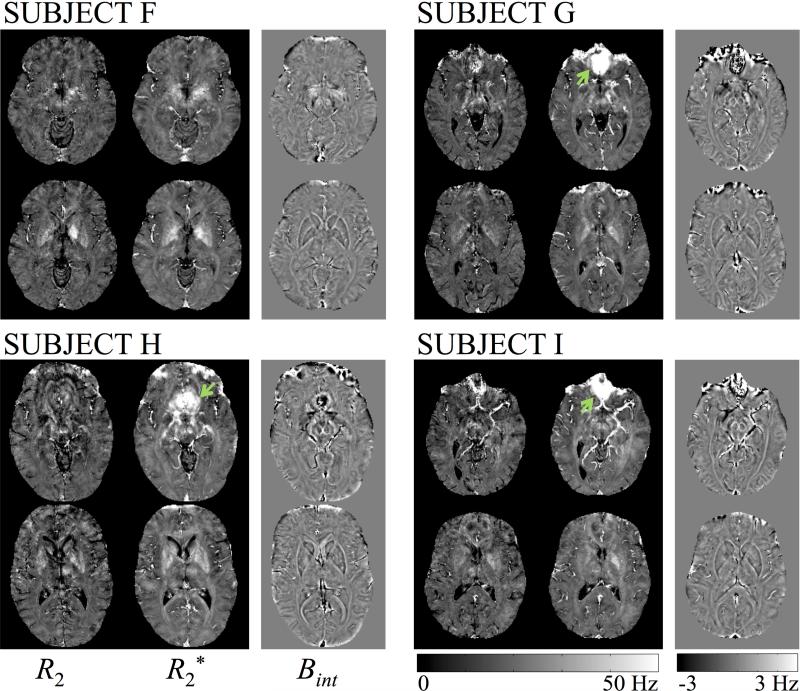
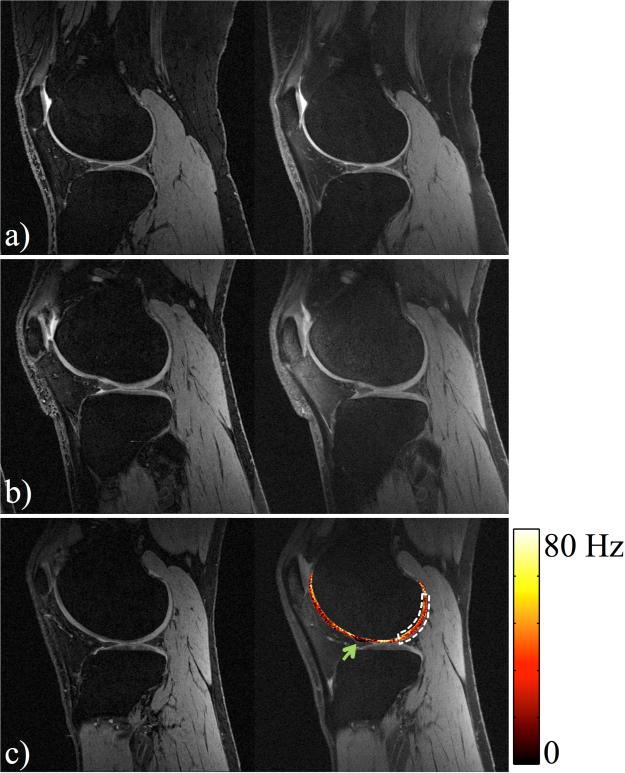
Methods: Typically, pulse sequences based on spin echoes are needed for T2 mapping while gradient echoes are needed for field mapping, making it difficult to jointly acquire both types of information. A dual-pathway multi-echo pulse sequence is employed here to generate T2 and field maps from the same acquired data. The approach might be used, for example, to obtain both thermometry and tissue damage information during thermal therapies, or susceptibility and T2 information from a same head scan, or to generate bonus T2 maps during a knee scan.

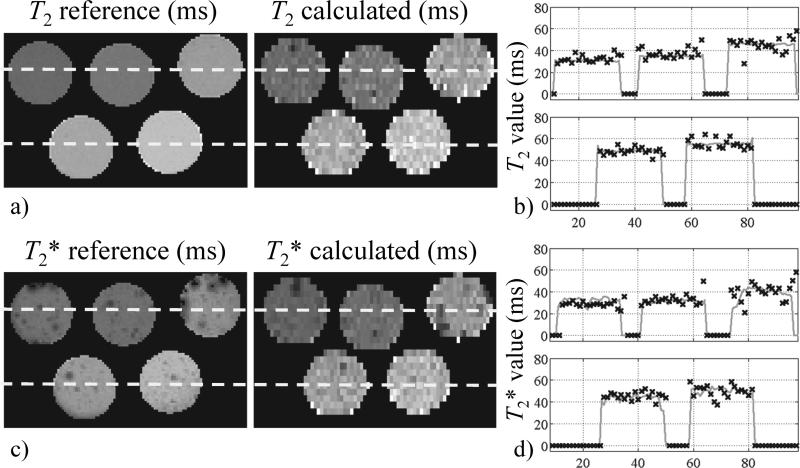
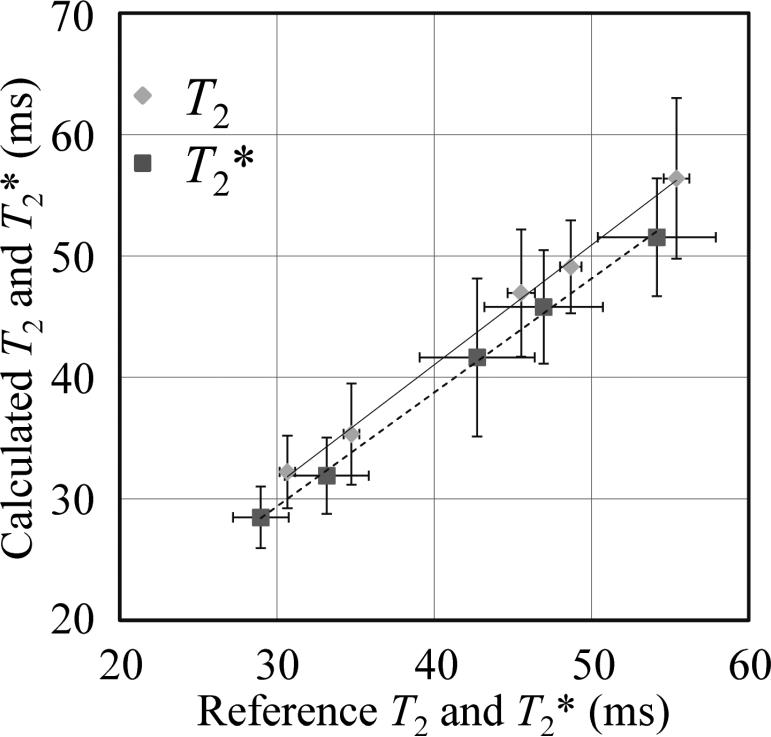
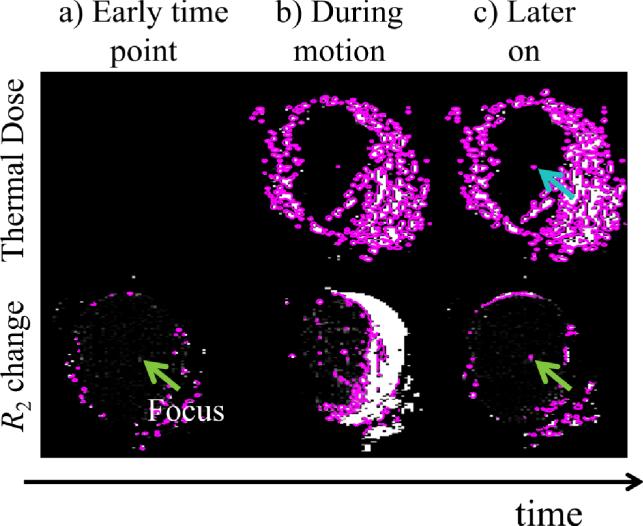
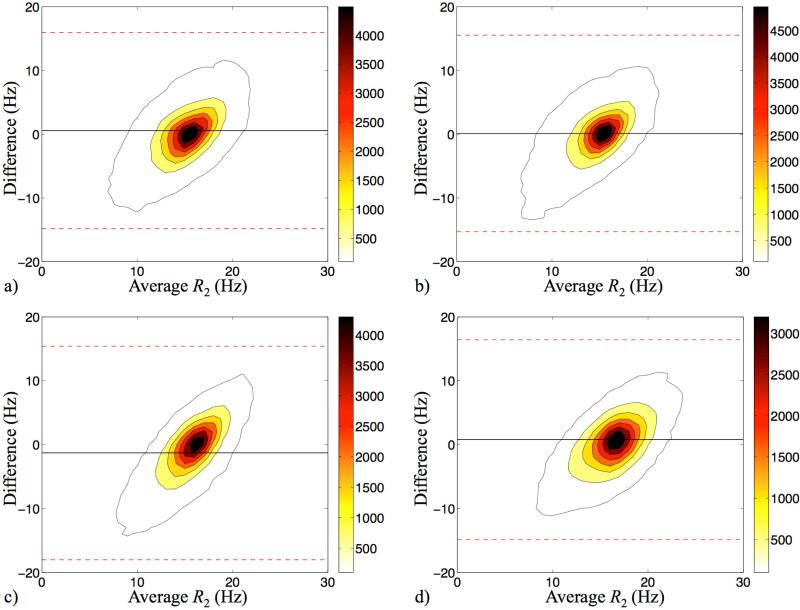
Results: Quantitative T2, T2(∗) and field maps were generated in gel phantoms, ex vivo bovine muscle, and twelve volunteers. T2 results were validated against a spin-echo reference standard: A linear regression based on ROI analysis in phantoms provided close agreement (slope/R(2)=0.99/0.998). A pixel-wise in vivo Bland-Altman analysis of R2=1/T2 showed a bias of 0.034 Hz (about 0.3%), as averaged over four volunteers. Ex vivo results, with and without motion, suggested that tissue damage detection based on T2 rather than temperature-dose measurements might prove more robust to motion.

Conclusion: T2, T2(∗) and field maps were obtained simultaneously, from the same datasets, in thermometry, susceptibility-weighted imaging and knee-imaging contexts.

Keywords: Field mapping; MR thermometry; Multi-pathway imaging; Osteoarthritis; Quantitative imaging; Susceptibility-weighted imaging; T(2) mapping.


Figures

Fig. 1
Fig. 1
a) The dual-pathway multi-echo pulse sequence employed here is depicted for the case NTE = 4. The 2D version is shown; the 3D version is nearly identical except for the addition of phase-encoding blips along Gz. b) A shorter-TR version of the sequence was also implemented whereby different echo times were obtained by switching the order of the FISP and PSIF echoes on alternate TR periods. The order of the echoes is determined by the size of the pre- and re-phaser pulses, shown shaded. The sequence in (b) was implemented on a GE system with moving table, for motion-related tests, while that in (a) was implemented on Siemens systems.
Fig. 2
Fig. 2
a) Relative temperature-to-noise-ratio as compared to a regular gradient-echo sequence is plotted as a function of the PSIF to FISP signal ratio, S0S0+, for a few different scenarios indicated in (b): A single echo per pathway (NTE = 1), four echoes per pathway (NTE = 4), using a FISP-PSIF ordering such that the FISP pathway is sampled first or alternately a reversed ordering such that the PSIF pathway is sampled first, with or without flyback. A few of these sampling schemes are depicted on the right-hand side of the figure, where the label ‘F’ represents readout windows when FISP signals are sampled while ‘P’ indicates when PSIF signals are acquired.
Fig. 3
Fig. 3
a) T2 results obtained from a multi-tube gel phantom are compared to a reference. The vast difference in SNR comes mainly from very different scan times: 51 min for the reference T2 map and only 3 seconds or so for the present joint T2 and T2* acquisition. b) Line plots are provided for the locations indicated by dashed lines in a), solid lines represent the reference while ‘×’ symbols are for the present method. c) T2* maps are compared; as in (a) differences in SNR come in part from very different scan times (64 s vs. 3 s). d) Line plots are provided for locations indicated by dashed lines in (c).
Fig. 4
Fig. 4
Average T2 and T2* values were obtained from ROIs at the center of the tubes shown in Fig. 2, and a linear regression was performed to test the accuracy of the proposed T2 and T2* mapping scheme against reference results. The fit results indicated good accuracy: Slope of 0.99/0.94, intersect of 1.61 /1.24 ms and R2 = 0.998/0.998 for T2 and T2*, respectively.
Fig. 5
Fig. 5
In the absence of motion a tissue damage criterion based on R2 changes (b) proved roughly equivalent to a thermal-dose criterion (a), as regions of similar size and location were identified in both cases: 28.5 vs. 24.2 mm2 in size (18% difference), and geometric centroids within the same pixel. While significant heating can be seen outside of the contoured region in (a), such heating was not sufficient to cause damage according to the 240 CEM43 criterion, pink contour in (a), or to the 100% R2-change criterion, pink contour in (b). A T2 value of 46±3 ms was measured over the white square ROI shown in (b).
Fig. 6
Fig. 6
R2 changes and temperature dose before (a), during (b), and after motion (c). In moving objects R2 changes may prove more reliable than thermal dose toward detecting tissue damage because the former are made on a frame-by-frame basis while the latter involve a time integral. For this reason, R2 measurements can recover from one or more bad frames while errors in temperature dose will propagate to all future time frames.
Fig. 7
Fig. 7
R2, R2* and Bint maps are shown for two different axial slices in the 3D volume, for our last 4 volunteers (F-I). Green arrows indicate regions that suffered from strong susceptibility effects, which led to higher R2* values and possibly less reliable R2 results than in other locations.
Fig. 8
Fig. 8
Contoured Bland-Altman plots compared the R2 results from spin-echo experiments and our DESS approach, for Subjects F-I (a-d). The outmost contours represent the sample density of 100 counts/Hz2. Black solid lines show the mean difference of the two measurements, and the red dashed lines represent the 95% limits of agreement. The averaged R2 difference was 0.034 Hz.
Fig. 9
Fig. 9
Reference DESS (left) and synthetic DESS images (right) for Subjects J-L. Similar image contrast was achieved in both cases, and led to similar measurements of cartilage volume (average difference: −4.93%). R2 information was displayed as an overlay in (c). The dark red region as marked with the green arrow, where R2 values were very small, may indicate the presence of joint fluid. An average T2 of 33.8 ms was calculated over the indicated ROI (white dashed region).

References

    1. Haacke EM, Xu Y, Cheng YC, Reichenbach JR. Susceptibility weighted imaging (SWI). Magn Reson Med. 2004;52(3):612–618. - PubMed
    1. Haacke EM, Cheng NY, House MJ, Liu Q, Neelavalli J, Ogg RJ, Khan A, Ayaz M, Kirsch W, Obenaus A. Imaging iron stores in the brain using magnetic resonance imaging. Magn Reson Imaging. 2005;23(1):1–25. - PubMed
    1. Langkammer C, Krebs N, Goessler W, Scheurer E, Ebner F, Yen K, Fazekas F, Ropele S. Quantitative MR imaging of brain iron: a postmortem validation study. Radiology. 2010;257(2):455–462. - PubMed
    1. De Poorter J, De Wagter C, De Deene Y, Thomsen C, Stahlberg F, Achten E. Noninvasive MRI thermometry with the proton resonance frequency (PRF) method: in vivo results in human muscle. Magn Reson Med. 1995;33(1):74–81. - PubMed
    1. Ishihara Y, Calderon A, Watanabe H, Okamoto K, Suzuki Y, Kuroda K. A precise and fast temperature mapping using water proton chemical shift. Magn Reson Med. 1995;34(6):814–823. - PubMed

Publication types