. 2016 Mar 8;14(9):2041-2049.
doi: 10.1016/j.celrep.2016.02.011. Epub 2016 Feb 25.

Reciprocal Degradation of YME1L and OMA1 Adapts Mitochondrial Proteolytic Activity during Stress

Affiliations

Reciprocal Degradation of YME1L and OMA1 Adapts Mitochondrial Proteolytic Activity during Stress

T Kelly Rainbolt et al. Cell Rep. .

Abstract

The mitochondrial inner membrane proteases YME1L and OMA1 are critical regulators of essential mitochondrial functions, including inner membrane proteostasis maintenance and mitochondrial dynamics. Here, we show that YME1L and OMA1 are reciprocally degraded in response to distinct types of cellular stress. OMA1 is degraded through a YME1L-dependent mechanism in response to toxic insults that depolarize the mitochondrial membrane. Alternatively, insults that depolarize mitochondria and deplete cellular ATP stabilize active OMA1 and promote YME1L degradation. We show that the differential degradation of YME1L and OMA1 alters their proteolytic processing of the dynamin-like GTPase OPA1, a critical regulator of mitochondrial inner membrane morphology, which influences the recovery of tubular mitochondria following membrane-depolarization-induced fragmentation. Our results reveal the differential stress-induced degradation of YME1L and OMA1 as a mechanism for sensitively adapting mitochondrial inner membrane protease activity and function in response to distinct types of cellular insults.


Figures

Figure 1
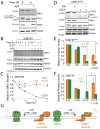
Figure 1. Membrane depolarization-induced OMA1 degradation requires ATP
A. Immunoblot of mitochondria isolated from SHSY5Y cells incubated with or without ATP (5 mM) at 37°C for 6 hours, as indicated. B. Representative immunoblot of lysates from SHSY5Y cells treated with CCCP (25 μM) alone or with 2-deoxy-D-glucose (2-DG, 10 mM) for the indicated time. C. Quantification of normalized OMA1 protein levels from immunoblots as depicted in Fig. 1B. Error bars show SEM for n=3. *p<0.05, **p<0.01, ***p<0.001 D. Immunoblot of lysates prepared from SHSY5Y cells cultured in galactose-supplemented media treated with oligomycin A (OA, 5 nM) and/or CCCP (50 μM) for 6 h. E. Quantification of normalized OMA1 and YME1L protein levels from immunoblots as shown in Fig. 1D. Error bars show SEM for n=3. *p<0.05 F. Quantification of normalized OMA1 and YME1L protein levels from immunoblots as shown in Fig. S1G. Error bars show SEM for n=4. *p<0.05 G. Illustration showing the differential degradation of YME1L and OMA1 induced by membrane depolarization in the presence or absence of ATP.
Figure 2
Figure 2. OMA1 degradation requires ATP-dependent YME1L activity
A. Immunoblot of mitochondria isolated from SHSY5Y cells incubated with ATP (5 mM), AMP-PNP (5 mM) and/or o-phenanthroline (o-phe, 1 mM), as indicated at 37°C for 6 hours. B. Immunoblot of lysates prepared from SHSY5Y cells expressing non-silencing or YME1L shRNA treated with CCCP (25 μM) for the indicated time. C. Quantification of normalized OMA1 protein levels from immunoblots as shown in Fig. 2B. Data were normalized to t=0 h for each shRNA respectively. Error bars show SEM for n=5. **p<0.01. D. Immunoblot of lysates prepared from SHSY5Y cells transfected with wild type OMA1HA or the E328Q OMA1HA treated with CCCP (25 μM) for the indicated time. E. Immunoblot of lysates prepared from SHSY5Y cells cultured in galactose-supplemented media expressing wild type OMA1HA or E328Q OMA1HA treated with antimycin A (100 nM) for the indicated time. F. Immunoblot of lysates prepared from SHSY5Y cells expressing non-silencing or YME1L shRNA, transfected with OMA1HA and treated with CCCP (25 μM) for the indicated time. G. Illustration showing the proposed two-step mechanism of stress-induced OMA1 activation and degradation. Membrane depolarization activates the OMA1 protease, allowing rapid processing of OMA1 substrates such as OPA1. Active OMA1 is then degraded by the ATP-dependent activity of YME1L suppressing OMA1 proteolytic activity.
Figure 3
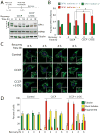
Figure 3. ATP depletion slows the recovery of tubular mitochondrial morphology following membrane depolarization induced fragmentation
A. Representative immunoblot of lysates prepared from SHSY5Y cells pretreated with 2-deoxy-D-glucose (2-DG; 10 mM) and/or CCCP (25 μM) for 6 h, washed, and recovered for the indicated times. An untreated control (U) is also shown. The experimental protocol is shown above. B. Quantification of OPA1 isoforms from immunoblots as shown in Fig. 3A. Error bars depict SEM for n=4. *p<0.05. C. Representative images of MEFs stably expressing mtGFP treated with 2-DG (10 mM) and/or CCCP (25 μM) as indicated for 2 hours, washed, and recovered for the indicated times. Scale bar indicates 5 μm. Red asterisks mark the center of the expanded region shown. D. Quantification of mitochondria morphology in cells (n≥40 cells per condition) from images as depicted in Fig. 3C. Error bars depict SEM from n=3 biologic replicates.
Figure 4
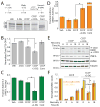
Figure 4. OPA1 Processing is Altered During Recovery from Membrane Depolarization and ATP Depletion
A. Representative autoradiogram of newly synthesized [35S]-OPA1 immunopurified from SHSY5Y cells pretreated for 6 h with 2-deoxy-D-glucose (2-DG, 10 mM) and/or CCCP (25 μM) as indicated. The labeling protocol is shown above. Arrows identify the different OPA1 isoforms. B. Quantification of total newly synthesized [35S]-OPA1 from autoradiograms as shown in Fig. 4A. Error bars show SEM for n=4. *p<0.05 C. Quantification of fraction OPA1 isoform d (produced by YME1L activity) from autoradiograms as shown in Fig. 4A. Error bars show SEM for n=4. *p<0.05 D. Quantification of fraction OPA1 isoform c (produced by OMA1 activity) from autoradiograms as shown in Fig. 4A. Error bars show SEM for n=4. *p<0.05 E. Representative immunoblot of lysates from SHSY5Y cells pretreated with 2-DG (10 mM) and/or CCCP (25 μM) for 6 h and allowed to recover for the indicated time. The experimental protocol used for this experiment is analogous to that shown in Fig. 3A. F. Quantification of normalized full-length and total (full-length OMA1 + s-OMA1) OMA1 protein levels from immunoblots as shown in Fig. 4E. The amount of s-OMA1 is reflected by the difference in full-length and total OMA1 as depicted. Error bars show SEM for n=4. *p<0.05.

References

    1. Anand R, Langer T, Baker MJ. Proteolytic control of mitochondrial function and morphogenesis. Biochim Biophys Acta. 2013;1833:195–204. - PubMed
    1. Anand R, Wai T, Baker MJ, Kladt N, Schauss AC, Rugarli E, Langer T. The i-AAA protease YME1L and OMA1 cleave OPA1 to balance mitochondrial fusion and fission. J Cell Biol. 2014;204:919–929. - PMC - PubMed
    1. Baburamani AA, Hurling C, Stolp H, Sobotka K, Gressens P, Hagberg H, Thornton C. Mitochondrial Optic Atrophy (OPA) 1 Processing Is Altered in Response to Neonatal Hypoxic-Ischemic Brain Injury. Int J Mol Sci. 2015;16:22509–22526. - PMC - PubMed
    1. Baker MJ, Lampe PA, Stojanovski D, Korwitz A, Anand R, Tatsuta T, Langer T. Stress-induced OMA1 activation and autocatalytic turnover regulate OPA1-dependent mitochondrial dynamics. EMBO J. 2014;33:578–593. - PMC - PubMed
    1. Bohovych I, Fernandez MR, Rahn JJ, Stackley KD, Bestman JE, Anandhan A, Franco R, Claypool SM, Lewis RE, Chan SS, et al. Metalloprotease OMA1 Fine-tunes Mitochondrial Bioenergetic Function and Respiratory Supercomplex Stability. Scientific reports. 2015;5:13989. - PMC - PubMed

Publication types

MeSH terms

Substances