. 2016 Apr 13;16(4):2633-8.
doi: 10.1021/acs.nanolett.6b00273. Epub 2016 Mar 4.

Super-Resolved Traction Force Microscopy (STFM)

Affiliations

Super-Resolved Traction Force Microscopy (STFM)

Huw Colin-York et al. Nano Lett. .

Abstract

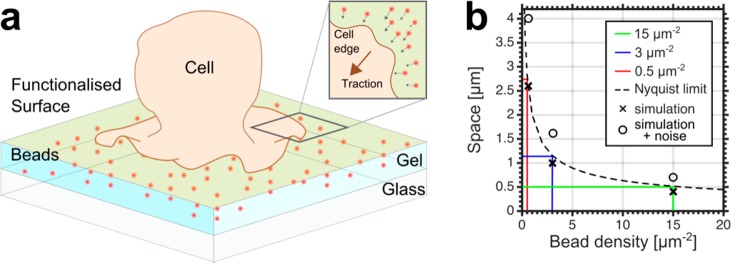
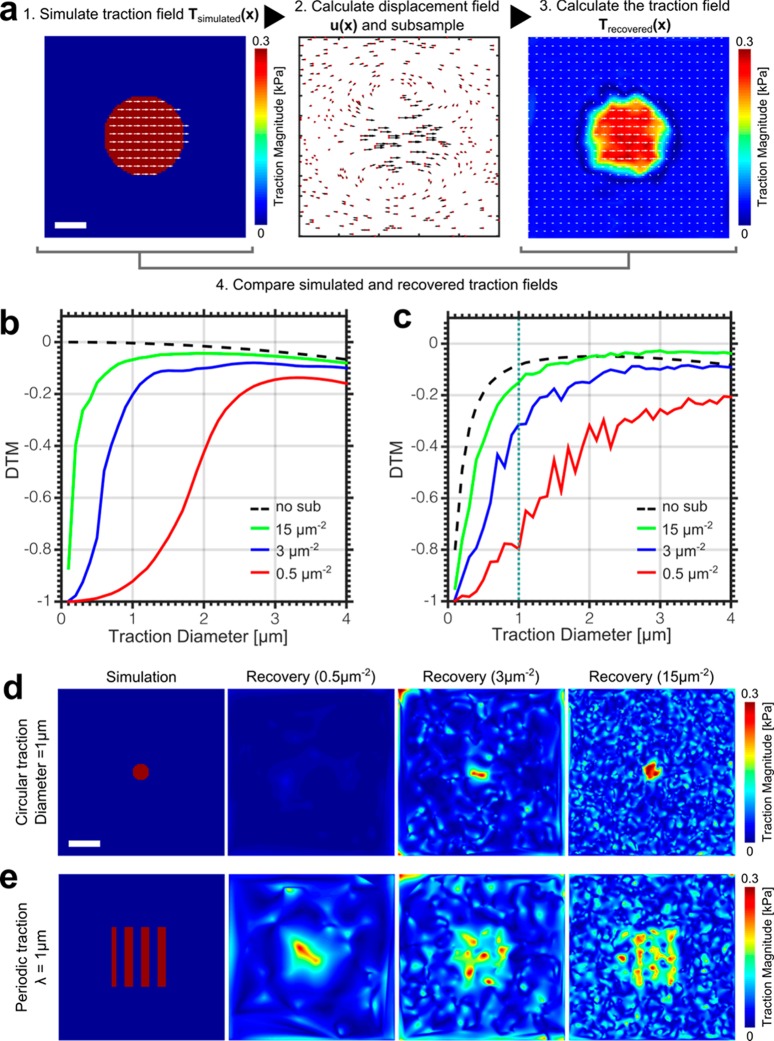
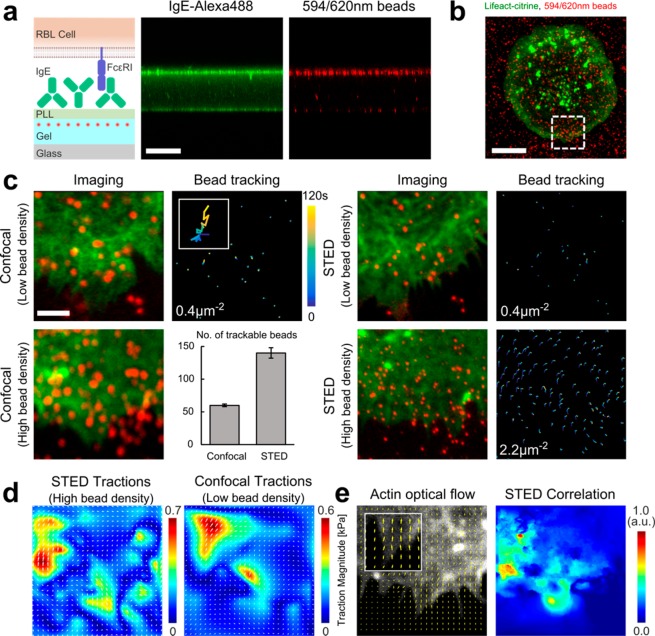
Measuring small forces is a major challenge in cell biology. Here we improve the spatial resolution and accuracy of force reconstruction of the well-established technique of traction force microscopy (TFM) using STED microscopy. The increased spatial resolution of STED-TFM (STFM) allows a greater than 5-fold higher sampling of the forces generated by the cell than conventional TFM, accessing the nano instead of the micron scale. This improvement is highlighted by computer simulations and an activating RBL cell model system.

Keywords: Super-resolution microscopy; actin cytoskeleton; mechanobiology; traction force microscopy.


Conflict of interest statement

The authors declare no competing financial interest.

Figures

Figure 1
Figure 1
Theoretical characterization of STFM. (a) Schematic representation of a typical TFM setup. An elastic polyacrylamide gel filled with fluorescent marker beads is covalently attached to a glass coverslip and functionalized with proteins that facilitate cell adherence. Traction forces applied by the cell to the top surface of the gel results in lateral displacements of the gel which can be quantified by imaging the displacement of the beads within the gel. (b) Theoretical relationship between the sampling density and the Nyquist limit (dashed line), with three different bead densities highlighted (red, blue, green as labeled), exemplifying that a bead density of 15 μm–2 would allow the recovery of tractions 500 nm in size. Crosses show the smallest recoverable tractions from simulations performed at the three bead densities shown in Figure 2. Open circles show the smallest recoverable traction from simulations where noise is added and regularization used.
Figure 2
Figure 2
Outline of the simulation process. (a) A uniform circular traction field Tsimulated(x) is simulated and the corresponding displacement field u(x) calculated (heat map; high traction magnitude warm colors, low traction magnitudes cold colors, white arrows: traction direction). The displacement field is then subsampled at a confocal and STED density (red dots: bead positions, black arrows: bead displacements), the traction field recovered Trecovered(x) and the simulation and recovery compared by the deviation of traction magnitude (DTM). Scale bar 1 μm. (b) DTM for varying traction diameters at three sampling densities, confocal (red), medium STED (blue), and maximum STED (green). A DTM of 0 represents a perfect traction recovery, whereas a DTM of −1 represents a complete underestimation. Dotted line: DTM for no subsampling. Line deviates from zero at large tractions due to artifacts introduced by the finite size of the simulated gel area. (c) Same as b with the addition of artificial noise and using the regularized solution, showing very similar dependency as b except for the no subsampling case (dotted line), where regularization masks the recovered tractions at length scales matching that of the artificial noise. (d) Simulation and traction recovery for a 1 μm diameter circular traction zone (0.3 kPa). Scale bar 2 μm. (e) Simulation and traction recovery for a 1 μm wavelength periodic traction pattern (0–0.3 kPa). Scale bar 2 μm.
Figure 3
Figure 3
Experimental demonstration of STFM. (a) Gel functionalization. (Left) Scheme: The roughly 30 μm thick PAA gel layer (light blue) was loaded with 40 nm-large red fluorescent beads (red dots) and surface-coated with poly-l-lysine (light green) followed by attachment of IgE (green). (Middle, right) Confocal zx profile images of the gel cross-section showing concentration of Alexa488 labeled IgE (green, middle) and red fluorescent beads (red, right) at the top surface of the gel. Scale bar 30 μm. (b) Representative confocal image of fluorescent F-actin (Lifeact-citrine) expressing RBL cell (green) interacting with IgE coated 3 kPa PAA gel loaded with the red fluorescent beads (red). Scale bar 10 μm. (c) Time-lapse imaging of the spreading cell edge results in the displacement of the beads within the gel, monitored for different conditions as labeled. (Left panels) Confocal images of fluorescent F-actin (green) and confocal or STED images of red fluorescent beads (red) at a certain time point together with the temporal displacement tracks of the beads (time color-coded as labeled), for low (0.4 μm–2) and high (2.2 μm–2) bead density. Scale bar 2 μm. For confocal at high bead density (lower left) no bead tracks could be resolved; instead a bar chart is shown, quantifying the ability to successfully locate and track beads in the high density confocal case compared to the high density STED case (total number of beads: 140 STED, 60 confocal). (d) Recovered traction field for the high density STED tracking of c (left) and extrapolated low density effective confocal tracking (right) with force color-coded in kPa. (e) Quantification of the F-actin flow from the high density STED recording of c by optical flow (left) and correlation (color coded with 1.0 showing maximum correlation) with the bead displacement (right).

References

    1. Trepat X.; Wasserman M. R.; Angelini T. E.; Millet E.; Weitz D. A.; Butler J. P.; Fredberg J. J. Nat. Phys. 2009, 5 (6), 426–430. 10.1038/nphys1269. - DOI
    1. Plotnikov S. V.; Pasapera A. M.; Sabass B.; Waterman C. M. Cell 2012, 151 (7), 1513–1527. 10.1016/j.cell.2012.11.034. - DOI - PMC - PubMed
    1. Iskratsch T.; Wolfenson H.; Sheetz M. P. Nat. Rev. Mol. Cell Biol. 2014, 15 (12), 825–833. 10.1038/nrm3903. - DOI - PMC - PubMed
    1. Nelson C. M.; Jean R. P.; Tan J. L.; Liu W. F.; Sniadecki N. J.; Spector A. A.; Chen C. S. Proc. Natl. Acad. Sci. U. S. A. 2005, 102 (33), 11594–11599. 10.1073/pnas.0502575102. - DOI - PMC - PubMed
    1. Vogel V.; Sheetz M. Nat. Rev. Mol. Cell Biol. 2006, 7 (4), 265–275. 10.1038/nrm1890. - DOI - PubMed

Publication types

LinkOut - more resources