. 2016 Feb 29:7:10798.
doi: 10.1038/ncomms10798.

Stem cell and neurogenic gene-expression profiles link prostate basal cells to aggressive prostate cancer

Affiliations

Stem cell and neurogenic gene-expression profiles link prostate basal cells to aggressive prostate cancer

Dingxiao Zhang et al. Nat Commun. .

Abstract

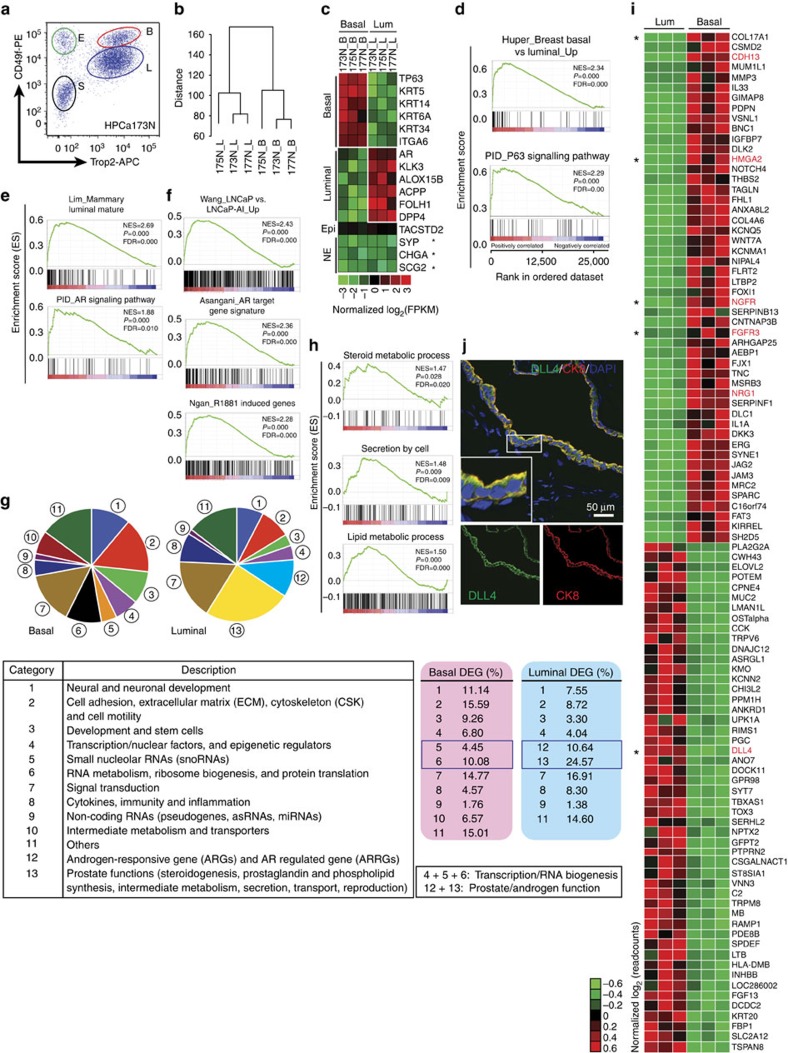
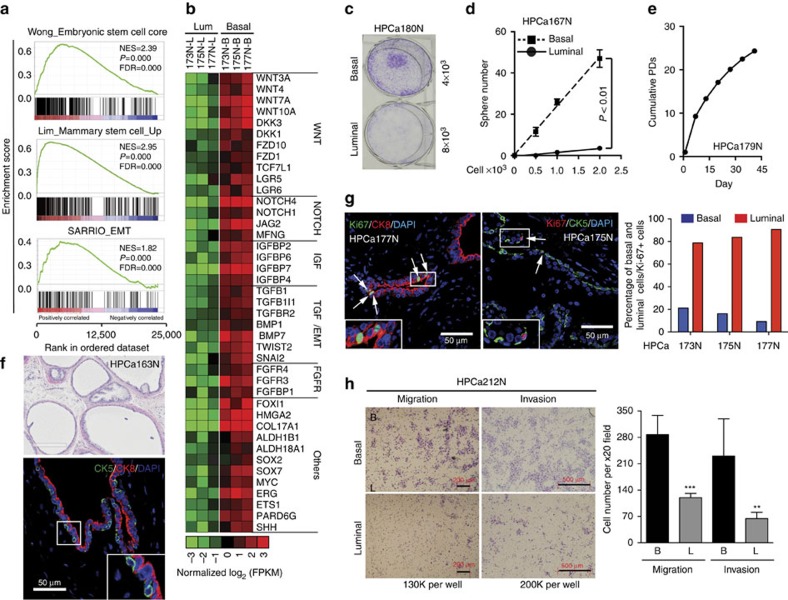
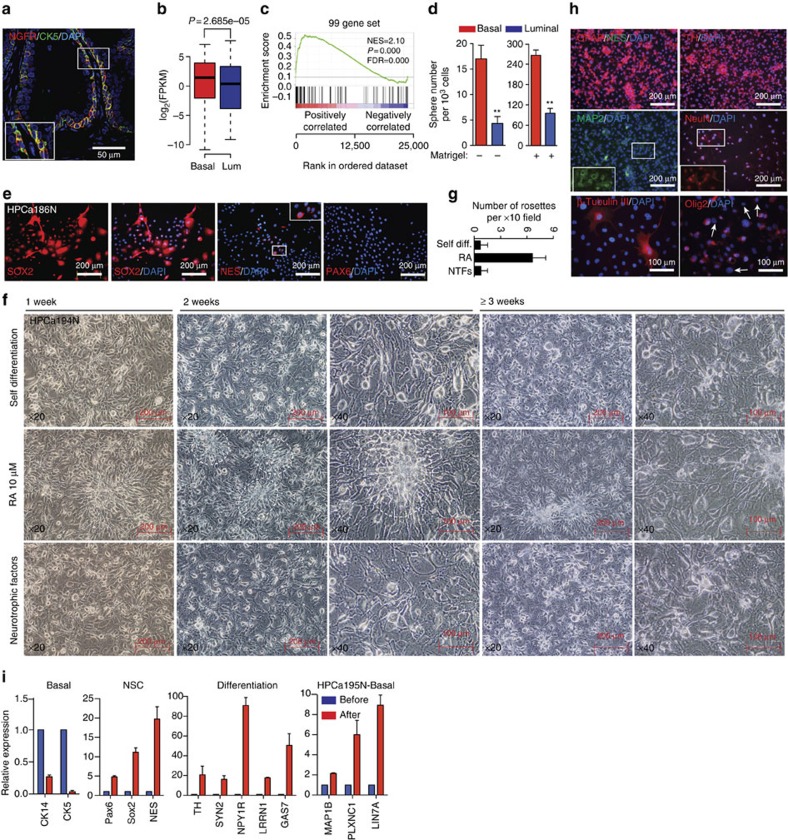
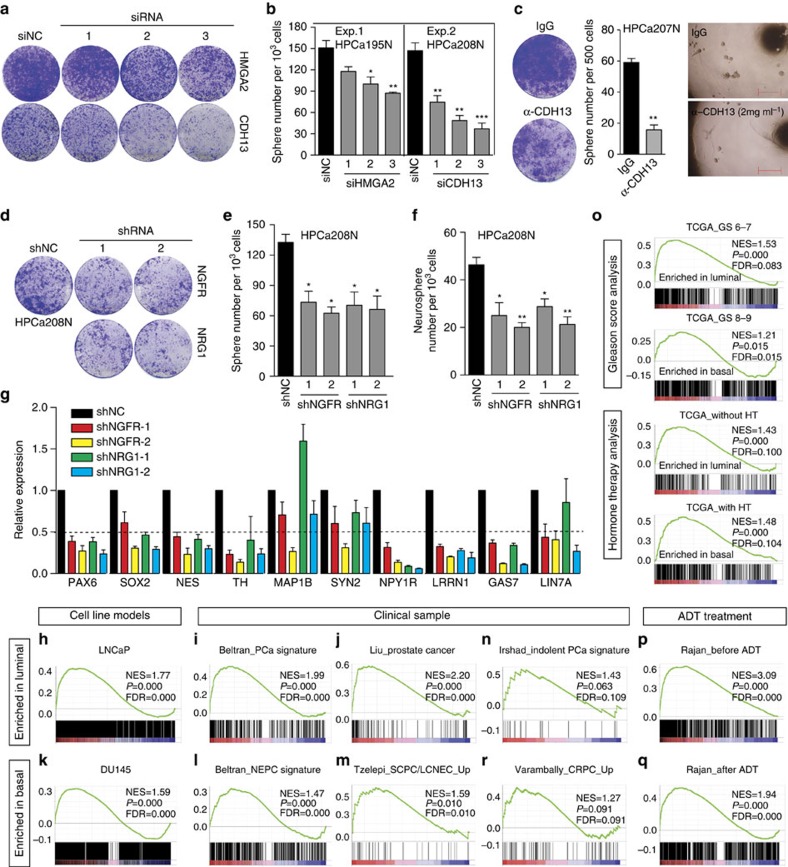
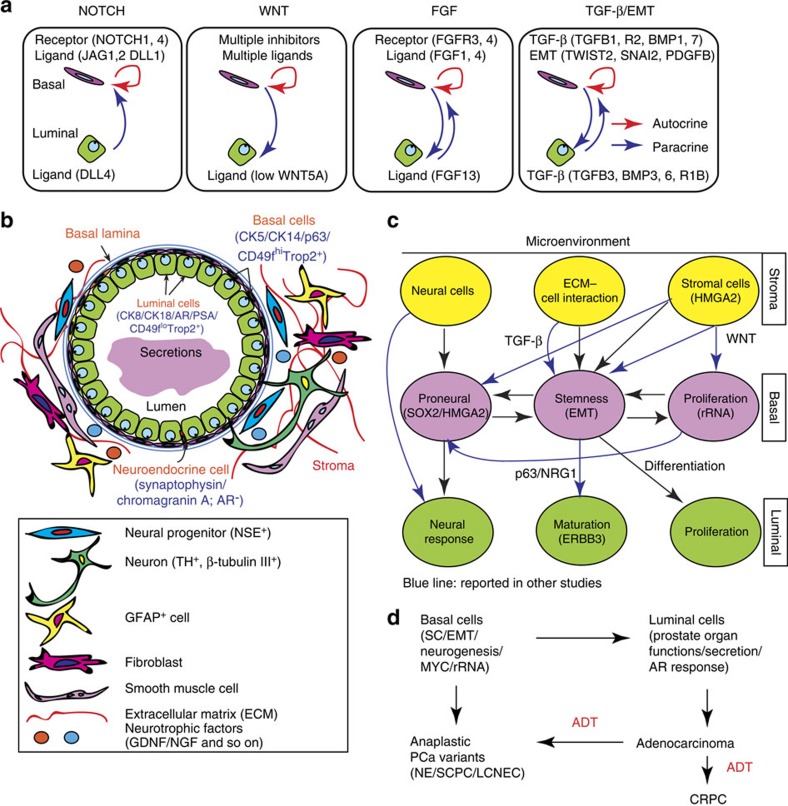
The prostate gland mainly contains basal and luminal cells constructed as a pseudostratified epithelium. Annotation of prostate epithelial transcriptomes provides a foundation for discoveries that can impact disease understanding and treatment. Here we describe a genome-wide transcriptome analysis of human benign prostatic basal and luminal epithelial populations using deep RNA sequencing. Through molecular and biological characterizations, we show that the differential gene-expression profiles account for their distinct functional properties. Strikingly, basal cells preferentially express gene categories associated with stem cells, neurogenesis and ribosomal RNA (rRNA) biogenesis. Consistent with this profile, basal cells functionally exhibit intrinsic stem-like and neurogenic properties with enhanced rRNA transcription activity. Of clinical relevance, the basal cell gene-expression profile is enriched in advanced, anaplastic, castration-resistant and metastatic prostate cancers. Therefore, we link the cell-type-specific gene signatures to aggressive subtypes of prostate cancer and identify gene signatures associated with adverse clinical features.


Figures

Figure 1
Figure 1. Distinct gene-expression profiles of prostatic basal and luminal cells.
(a) FACS plots of prostate basal (B), luminal (L), endothelial-enriched (E) and stromal-enriched (S) populations identified as Trop2+CD49fhi, Trop2+CD49flo, Trop2-cd49fhi and Trop2-CD49f-, respectively. (b) Hierarchical clustering of RNA-Seq data in three pairs of benign prostatic basal (N_B) and luminal (N_L) cells. All detected genes were used in the clustering analysis. y-axis shows euclidean distance for log2 (normalized read counts). (c) Heatmap presentation of expression of known phenotypic markers corresponding to different prostate cell lineages. Asterisks indicates the genes expressed at very low levels (FPKM<0.18). (df) Representative GSEA results in basal (d) and luminal (e) cells. In (f), androgen-responsive genes and AR-regulated genes in the three indicated data sets are enriched in luminal cells. (g) Distinct transcriptomic profiles of human prostatic basal and luminal cells. Shown are pie charts of gene categories (Supplementary Data 1) over-represented in basal and luminal populations. Descriptions of each functional category are given in the table below. Percentages of each category in basal versus luminal cells are marked in red and blue, respectively (below, right). (h) GSEA results for the enrichment of indicated gene signatures in luminal cells. (i) Heatmap of the top 50 putative marker genes in each epithelial lineage. Asterisks indicate the genes whose exclusive cellular localization has been confirmed by immunofluorescence. Genes with their biological functions investigated in this study are coloured in red. See the ‘Methods' section for detail. (j) Immunofluorescence of DLL4 and CK8 in benign prostate tissues. Scale bars, 50 μm.
Figure 2
Figure 2. SC and EMT properties of human prostatic basal cells.
(a) GSEA showing enrichment of SC and EMT gene signatures in basal cells. (b) Heatmap of representative SC-associated genes overexpressed in basal cells. (ce) Basal cells exhibit high stem/progenitor activities in vitro. Shown are colony formation, (c) limiting dilution sphere assay, (d) and cumulative population doubling (PDs) (e) of basal cells derived from one, but a different, patient sample respectively. Results shown (HPCa179N) were representative data of 3 repeat experiments in different patient-derived cell populations. (f) Hematoxylin and eosin staining and immunofluorescence of CK5 and CK8 in prostate tissue regenerated in vivo from HPCa163N primary basal cells co-injected with mouse UGSM. (g) Immunofluorescence of Ki-67, CK8 and CK5 in human benign prostate tissues (left) and quantification of % Ki-67+ cells according to lineage identity (right). (h) Migration and invasion assays in basal and luminal cells freshly purified from HPCa212N. Representative low-magnification images (left) and quantification data (right) are shown. Data represent means±s.d. from cell number counting of 5–6 random high magnification (× 20) images. Results shown (HPCa212N) were representative data of at least 2–3 repeat experiments in different patient-derived cell populations. The P value was calculated using Student's t-test **P<0.01 and ***P<0.001. Boxed regions are enlarged. The white arrows indicate the cells stained positive for Ki-67. Scale bars, 50 μm; 200 μm; 400 μm; 500 μm (f bottom and g; h left, migration; f top; and h right, invasion, respectively).
Figure 3
Figure 3. Signalling pathways that regulate human prostatic basal stem/progenitor cell activity.
(a) Genome-browser view of RNA-Seq signals in FGFR3 gene region (left) and immunofluorescence of FGFR3 in HPCa177N (right). (b,c) Effects of select pathway inhibitors on colony formation (b), and sphere-forming efficiency and sphere size of basal cells (c). Data in c was presented as the relative values of treatment groups normalized to vehicle control groups. (d) Summary of the data from b and c, and Supplementary Fig. 3d,e. (e,f) Knocking down of indicated molecules in basal cells reduced colony (e) and sphere (f) formation. (g) Loss of indicated signalling in basal cells promotes differentiation. qRT–PCR analysis of AR, KLK3 and KRT18 in spheres treated with SU5402 (5 μM), DAPT (10 μM), XAV-939 (20 μM) or DMSO in the presence of dihydrotestosterone (DHT). Experiments for the first two and last inhibitors were performed in HPCa207N and HPCa208N basal cells, respectively. The P value was calculated using Student's t-test *P<0.05 and **P<0.01. Data represent means±s.d. from a representative experiment of at least 2 biological repeats in different human samples (c,f,g).
Figure 4
Figure 4. Enhanced rRNA transcription and ribosome biogenesis in basal cells.
(ac) GSEA showing enrichment of indicated gene signatures in basal cells (a,c) and basal cells possess higher total RNA contents than luminal cells (b). For b, cells were purified from the indicated benign prostate tissues, lysed, and total RNA content per 1,000 cells determined. (d,e) Overexpression of Myc and its transcriptional programme in basal (red) compared to luminal (blue) cells (d) and heatmap of relative expression levels of Pol I complex components and key genes involved in rRNA processing in basal and luminal (Lum) cells (e). Genes upregulated in basal cells with either FDR<0.05 or P<0.05 are coloured in red. See the ‘Methods' section for detail. (f) Pre-rRNA expression determined by qRT–PCR of the internally transcribed spacer (ITS2) of the human 47S pre-rRNA in paired fresh basal and luminal cell populations purified from three benign prostate samples. (g) Effects of Actinomycin D and CX-5461 on colony formation of HPCa208N basal cells. (h) Effects of JQ1 on basal cell proliferation (left) and expression of indicated genes (right). Cells derived from HPCa204N and HPCa207N were used, respectively. (i) Knocking down of CD3EAP in HPCa208N basal cells reduces colony formation (upper), sphere formation and sphere size (lower). The P value was calculated using Student's t-test *P<0.05 and **P<0.01. Data represent means±s.e.m. from 3 biological repeats (d), and means±s.d. from a representative experiment of at least 2 biological repeats in human samples (f,h,i).
Figure 5
Figure 5. Intrinsic proneural properties of human prostate basal epithelial cells.
(a) Immunofluorescence of NGFR and CK5 in benign prostate tissue showing the basal localization for NGFR. (b,c) Gene-expression plot (b) and GSEA (c) indicate that basal cells overexpress a set of proneural genes (n=99, Supplementary Table 4) essential for neural and neuronal development. (d) In neurosphere suspension culture condition, primary HPCa202N basal cells generated spheres more efficiently than luminal cells. Values are mean±s.d. (e) Immunofluorescence analysis of SOX2, NES (Nestin) and PAX6 in HPCa186N primary basal cell cultures. (f) Representative images showing cell morphological changes of basal cells in various culture conditions (See the ‘Methods' section) at different time points after confluence. The white elliptical lines indicate the rosette cluster-like structures. (g) Quantification of rosette-like structures in f. NTFs, NFs. (h) Immunofluorescence analysis of neural lineage markers indicated in end point basal cell cultures shown in f. White arrows indicate the cells negative for Olig2 staining. (i) qRT–PCR analysis of basal cell and NSC markers and a panel of neural/neuronal genes in basal cells before and after proneural differentiation. The P value was calculated using Student's t-test *P<0.05 and **P<0.01. Data represent means±s.d. from a representative experiment of at least 2 biological repeats in different human samples (d,g,i).
Figure 6
Figure 6. Proneural genes regulate prostatic basal cell stem/progenitor activities and the basal gene-expression profile is linked to aggressive PCa.
(a,b) Knocking down of HMGA2 and CDH13 reduce 2D colony (a) and 3D sphere (b) formation in primary basal cells. (c) Neutralization of CDH13 protein by blocking antibody inhibits basal cell proliferation and sphere-forming ability. (d,e) Knocking down of NGFR and NRG1 by shRNA in basal cells reduces colony (d) and sphere (e) formation. (f) Knocking down of NGFR and NRG1 by shRNA inhibits neurosphere formation in primary basal cells. Bars in e and f represent the mean±s.d. (g) qRT–PCR analysis of NSC markers and a panel of neural/neuronal genes in HPCa208N basal cells treated with shRNAs after proneural differentiation. (hr) GSEA showing enrichment of indicated PCa gene signatures in human benign prostatic luminal and basal cells. See the ‘Methods' section for details. The P value was calculated using Student's t-test *P<0.05, **P<0.01, ***P<0.001. Data represent means±s.d. from a representative experiment of at least 2 biological repeats in different human samples (b,c,e,f,g).
Figure 7
Figure 7. Transcriptome-derived models of crosstalk between prostatic epithelial lineages and between epithelial cells and microenvironment.
(a) Schematic illustration of crosstalk in representative signalling pathways between prostatic basal and luminal cells. Preferentially expressed genes in each lineage are indicated. (b) A schematic illustrating potential crosstalk between epithelial cells and ECM and stromal cells. (c) Schematic illustration of reciprocal signalling crosstalk between basal, luminal cells and stromal compartments. Black arrows indicate data obtained in this study and blue arrows the interactions reported in the literature. (d) Basal cells could potentially function directly as the cells-of-origin for anaplastic variant PCa and/or indirectly as the cells-of-origin for adenocarcinomas via differentiation into luminal cells.

Comment in

References

    1. Liu X. et al. Systematic dissection of phenotypic, functional, and tumorigenic heterogeneity of human prostate cancer cells. Oncotarget 6, 23959–23986 (2015). - PMC - PubMed
    1. Qin J. et al. The PSA(-/lo) prostate cancer cell population harbors self-renewing long-term tumor-propagating cells that resist castration. Cell Stem Cell 10, 556–569 (2012). - PMC - PubMed
    1. Shen M. M. & Abate-Shen C. Molecular genetics of prostate cancer: new prospects for old challenges. Genes Dev. 24, 1967–2000 (2010). - PMC - PubMed
    1. Pignon J. C. et al. p63-expressing cells are the stem cells of developing prostate, bladder, and colorectal epithelia. Proc. Natl Acad. Sci. USA 110, 8105–8110 (2013). - PMC - PubMed
    1. Burger P. E. et al. Sca-1 expression identifies stem cells in the proximal region of prostatic ducts with high capacity to reconstitute prostatic tissue. Proc. Natl Acad. Sci. USA 102, 7180–7185 (2005). - PMC - PubMed

Publication types