Review
. 2016 May;34(5):420-433.
doi: 10.1016/j.tibtech.2016.02.001. Epub 2016 Feb 26.

Photoacoustic Molecular Imaging: From Multiscale Biomedical Applications Towards Early-Stage Theranostics

Affiliations
Review

Photoacoustic Molecular Imaging: From Multiscale Biomedical Applications Towards Early-Stage Theranostics

Yajing Liu et al. Trends Biotechnol. 2016 May.

Abstract

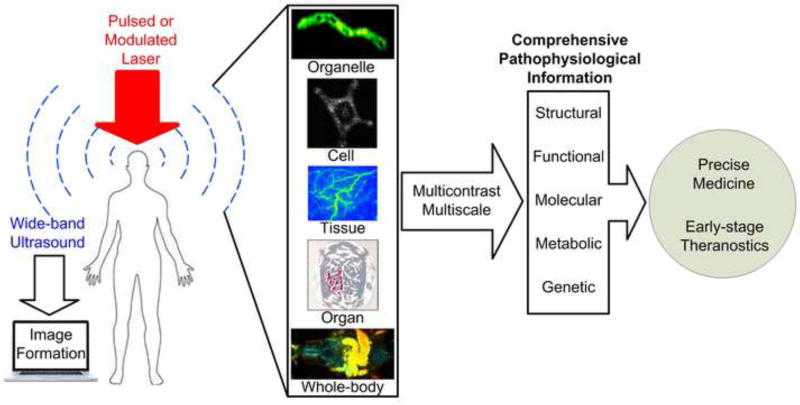
Photoacoustic imaging (PAI) has ushered in a new era of observational biotechnology and has facilitated the exploration of fundamental biological mechanisms and clinical translational applications, which has attracted tremendous attention in recent years. By converting laser into ultrasound emission, PAI combines rich optical contrast, high ultrasonic spatial resolution, and deep penetration depth in a single modality. This evolutional technique enables multiscale and multicontrast visualization from cells to organs, anatomy to function, and molecules to metabolism with high sensitivity and specificity. The state-of-the-art developments and applications of PAI are described in this review. Future prospects for clinical use are also highlighted. Collectively, PAI holds great promise to drive biomedical applications towards early-stage theranostics.

Keywords: early-stage theranostics; multiscale biomedical application; photoacoustic imaging; smart contrast agents.


Figures

Figure 1
Figure 1
Photoacoustic molecular imaging for multi-scalable biomedical applications and potential trends towards early-stage theranostics [, , –87].
Figure 2
Figure 2. PAM embodiments and wavefront engineering
(A) Schematic of OR-PAM, where fast scanning is achieved by a MEMS mirror [7]. (B) Schematic of AR-PAM [6]. (C) Concept of TROVE focusing. In TROVE imaging, multiple randomized input wavefronts are frequency-shifted, decoded and time reversed [15]. (D) Gaussian-shape based PA signals to guide wavefront optimization [18]. Abbreviations: PAM (photoacoustic microscopy); OR-PAM (optical-resolution photoacoustic microscopy); OAC (optical-acoustic combiner); PBS (polarizing beam splitter); UT (ultrasonic transducer); MEMS (microelectromechanical scanner); AR-PAM (acoustic-resolution photoacoustic microscopy); TROVE (time reversal of variance encoded light).
Figure 3
Figure 3. Multifunctional PAM platforms
(A) PAFC of RBCs in different vessels [20]. (B) PA flowoxigraphy of oxygen metabolism [88]. (C) Scheme of FRET PAM [29]. (D) Optical-resolution PAE [35]. Abbreviations: PAFC (photoacoustic flow cytometry); RBCs (red blood cells); FRET (Förster resonance energy transfer); PAE (photoacoustic endoscopy).
Figure 4
Figure 4. Major implementations of PACT
(A) In vivo MSOT (multispectral optoacoustic tomography) imaging of athymic mouse acquired at 750 nm [39]. (B) Anterior–posterior MIP image of the human breast by hemispherical array-based PACT [48, 50]. (C) Co-registered US/PA image of a zebrafish acquired by a high-frequency linear-array PACT system [54].
Figure 5
Figure 5. PAI of multiple endogenous and exogenous contrasts
(A) Microvasculature within a tumor region. The blue region indicates decreased sO2 of the early-stage tumor [25]. (B) 3D PA images of lymph nodes at 530 nm and 1210 nm showing hemoglobin and lipid contrast, respectively [58]. (C) Intravascular PAT of lipid-rich plaques [89]. (D) In vivo PA image of tyrosinase labelled xenografts against the surrounding vasculature [66]. (E) PA maximum intensity projection of an intestine labeled with ZnBNc nanonaps [67]. (F) Overlaid PA and ultrasound imaging of palladium nanosheet-targeted tumor [77]. (G) PAT of a mouse brain tumor after injection with tri-modality MRI-PA-Raman (MPR) nanoparticles [63].
Figure 6
Figure 6. PAT for early-stage diagnostic, drug metabolism, and therapy monitoring
(A) Nutrition supply vasculature on a tumor was imaged by PAM six hours after GO injection [6]. (B) 3D US/PA images of SLNs show the increased PA signal following the injection of Si-AuNPs [79]. (C) PA mamoscope images of tumor vasculature in a patient with invasive ductal carcinoma [78]. (D) PAT images of a rat ankle joint, showing increased PA signal associated with inflammatory arthritis [80]. (E) In vivo PA images of spleen in a rat after injection of GNS, illustrating that the signals significantly increased in spleen compared with decreased PA signal in vascular [81]. (F) Scalable PAM images of tumor vasculature using GO-Cy5.5-Dox contrast, depicting that the angiogenic vessels were greatly disrupted 8 days after chemotherapy [6]

References

    1. Wang L, et al. Ultrasonically encoded photoacoustic flowgraphy in biological tissue. Phys. Rev. Lett. 2013;111:204301. - PMC - PubMed
    1. Zharov VP. Ultrasharp nonlinear photothermal and photoacoustic resonances and holes beyond the spectral limit. Nat. Photonics. 2011;5:110–116. - PMC - PubMed
    1. Wang LV, Hu S. Photoacoustic tomography: in vivo imaging from organelles to organs. Science. 2012;335:1458–1462. - PMC - PubMed
    1. Mallidi S, et al. Photoacoustic imaging in cancer detection, diagnosis, and treatment guidance. Trends Biotechnol. 2011;29:213–221. - PMC - PubMed
    1. Hu S, Wang LV. Optical-resolution photoacoustic microscopy: auscultation of biological systems at the cellular level. Biophys. J. 2013;105:841–847. - PMC - PubMed

Publication types

MeSH terms

LinkOut - more resources