. 2016 Jun:133:31-40.
doi: 10.1016/j.neuroimage.2016.02.058. Epub 2016 Feb 26.

Reproducibility of resting state spinal cord networks in healthy volunteers at 7 Tesla

Affiliations

Reproducibility of resting state spinal cord networks in healthy volunteers at 7 Tesla

Robert L Barry et al. Neuroimage. 2016 Jun.

Abstract

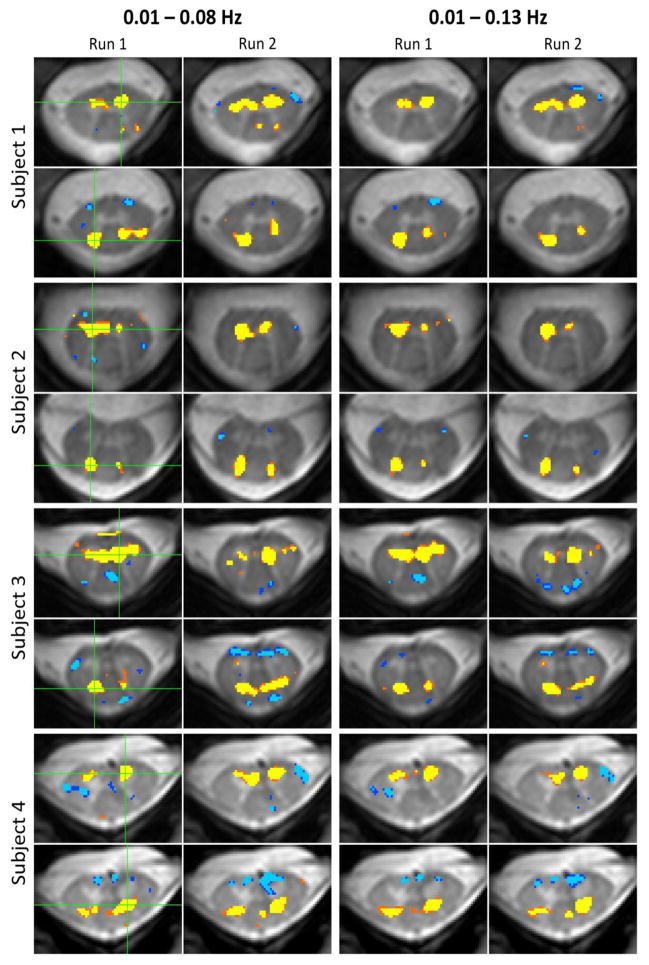
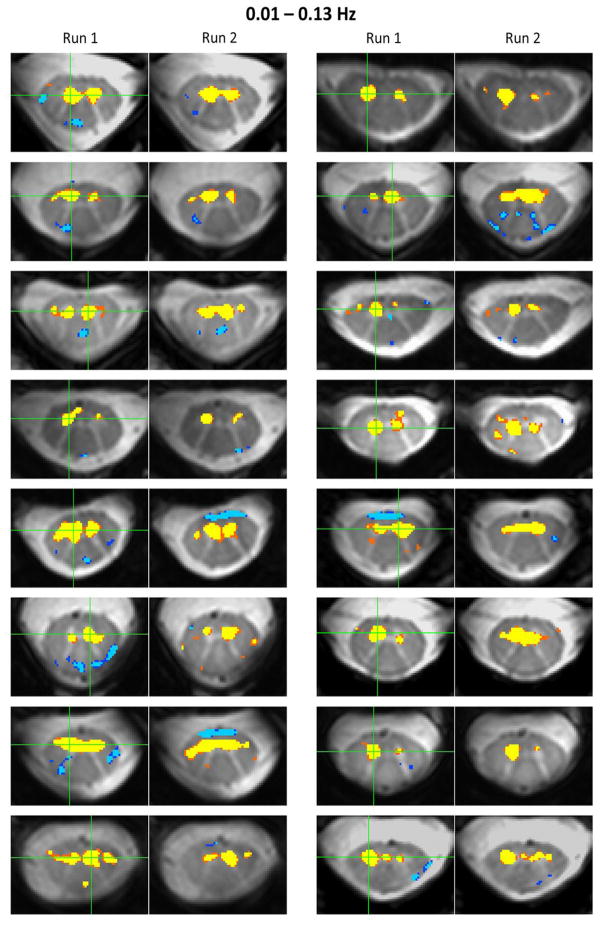
We recently reported our findings of resting state functional connectivity in the human spinal cord: in a cohort of healthy volunteers we observed robust functional connectivity between left and right ventral (motor) horns and between left and right dorsal (sensory) horns (Barry et al., 2014). Building upon these results, we now quantify the within-subject reproducibility of bilateral motor and sensory networks (intraclass correlation coefficient=0.54-0.56) and explore the impact of including frequencies up to 0.13Hz. Our results suggest that frequencies above 0.08Hz may enhance the detectability of these resting state networks, which would be beneficial for practical studies of spinal cord functional connectivity.


Conflict of interest statement

COMPETING FINANCIAL INTERESTS

The authors declare no competing financial interests.

Figures

Figure 1
Figure 1
Acquisition and analysis strategy for resting state spinal cord fMRI at 7 Tesla. (a) Mid-sagittal slice from a healthy volunteer showing the cervical spinal cord and imaging stack centered on the C3/C4 intervertebral disc. (b) For each axial slice in the imaging stack, measurements of functional connectivity between ventral (motor) horns and between dorsal (sensory) horns are calculated. Partial correlations are also calculated between ventral and dorsal horns on each side to investigate the reproducibility of ipsilateral correlations.
Figure 2
Figure 2
Within-slice partial correlations between (a) ventral horns, (b) dorsal horns, (c) left ventral and dorsal horns, and (d) right ventral and dorsal horns. Resting state data were filtered using a 0.01–0.08 Hz bandpass filter before analyses of functional connectivity. Each point represents a pair of z-scores for one slice in one subject (23 subjects × 12 slices/subject = 276 points). To investigate possible slice-level biases across subjects, red denotes values from the superior four slices (C2/C3), green denotes values from the middle four slices (C3/C4), and blue denotes values for the inferior four slices. The majority of ipsilateral correlations (i.e., between ventral and dorsal horns; c and d) lie between z = 0 and z = 4, so these values are marked by solid vertical and horizontal lines on all plots to facilitate visual comparisons between scatterplots. Finally, the black diamond denotes the center of mass of all 276 correlation pairs, where each pair is given equal weighting. These analyses reveal that resting state spinal cord motor (a) and sensory (b) networks both exhibit moderate reproducibility (ICC = 0.54), although mean ventral horn connectivity (z = 4.42) is markedly higher than dorsal horn connectivity (z = 3.24). In comparison, partial correlations between ventral and dorsal horns is low (z = 2.26 across both left and right) and has low reproducibility (ICC = 0.39 and 0.24, respectively).
Figure 3
Figure 3
The analyses performed to generate Figure 2 were repeated after resting state data were filtered using a 0.01–0.13 Hz bandpass filter. As before, these plots display within-slice partial correlations between (a) ventral horns, (b) dorsal horns, (c) left ventral and dorsal horns, and (d) right ventral and dorsal horns. A few correlations exceed a z-score of 10 in (a) and (b), but the dynamic range was kept at −2 < z < 10 for all plots to facilitate a comparison with Figure 2 (because the vast majority of z-scores are less than 10). The inclusion of frequencies between 0.08 and 0.13 Hz shifts the center of mass (black diamond) upwards along the line of unity in all plots, but this increase is considerably higher for motor network connectivity (Δz = 1.06 to z = 5.48) and sensory network connectivity (Δz = 0.60 to z = 3.84) than ipsilateral partial correlations on the left (Δz = 0.23 to z = 2.57) and right (Δz = 0.24 to z = 2.43) sides. Motor and sensory networks exhibit moderate reproducibility (ICC = 0.56) whereas partial correlations between ipsilateral ventral and dorsal horns (with markedly lower z-scores) demonstrate lower reproducibility (ICC = 0.46 and 0.36, respectively).
Figure 4
Figure 4
Examples of reproducible spatial correlations for ventral (motor) and dorsal (sensory) resting state spinal cord networks in C3/C4 across four subjects. A single voxel time series (identified with a green cross in the first column) was selected from a ventral horn and a dorsal horn, and significant correlations (p < 0.0001) throughout gray and white matter were overlaid onto the high-resolution image. The second column displays correlations for the same seed regions but using data from the second resting state run. These 16 single-voxel correlation analyses were then repeated after resting state data are were re-filtered using a 0.01–0.13 Hz bandpass filter to visualize changes in spatial correlation patterns caused by the inclusion of higher frequencies.
Figure 5
Figure 5
Examples of reproducible spatial correlations for ventral resting state networks in C3 across an additional 16 subjects. All resting state data were filtered using a 0.01–0.13 Hz bandpass filter. For each pair of images, the seed region is identified with a green cross and significant correlations (p < 0.0001) throughout gray and white matter were overlaid onto the high-resolution image. The extent of positive gray matter correlations exhibit differences from one subject to the next, but overall the most significant and reproducible positive correlations are observed within gray matter horns, and secondary correlations with adjacent white matter are less reproducible between runs.

References

    1. Barry RL, Smith SA, Dula AN, Gore JC. Resting state functional connectivity in the human spinal cord. Elife. 2014;3:e02812. - PMC - PubMed
    1. Barry RL, Strother SC, Gatenby JC, Gore JC. Data-driven optimization and evaluation of 2D EPI and 3D PRESTO for BOLD fMRI at 7 Tesla: I. Focal coverage Neuroimage. 2011;55:1034–1043. - PMC - PubMed
    1. Biswal B, Yetkin FZ, Haughton VM, Hyde JS. Functional connectivity in the motor cortex of resting human brain using echo-planar MRI. Magn Reson Med. 1995;34:537–541. - PubMed
    1. Braun U, Plichta MM, Esslinger C, Sauer C, Haddad L, Grimm O, … Meyer-Lindenberg A. Test-retest reliability of resting-state connectivity network characteristics using fMRI and graph theoretical measures. Neuroimage. 2012;59:1404–1412. - PubMed
    1. Cadotte DW, Cadotte A, Cohen-Adad J, Fleet D, Livne M, Wilson JR, … Fehlings MG. Characterizing the location of spinal and vertebral levels in the human cervical spinal cord. AJNR Am J Neuroradiol. 2015;36:803–810. - PMC - PubMed

Publication types