. 2016 Mar 16;89(6):1208-1222.
doi: 10.1016/j.neuron.2016.01.042. Epub 2016 Feb 25.

Down Syndrome Developmental Brain Transcriptome Reveals Defective Oligodendrocyte Differentiation and Myelination

Affiliations

Down Syndrome Developmental Brain Transcriptome Reveals Defective Oligodendrocyte Differentiation and Myelination

Jose Luis Olmos-Serrano et al. Neuron. .

Abstract

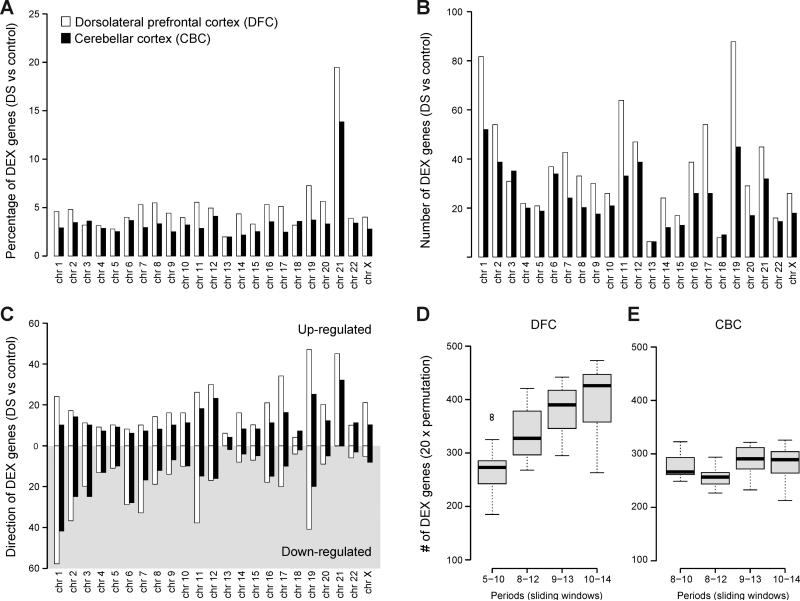
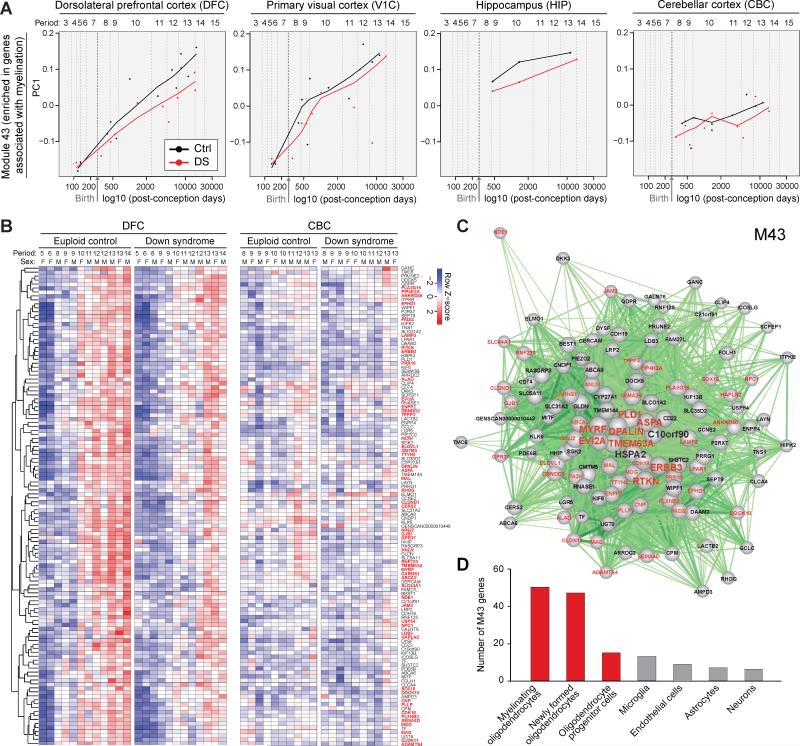
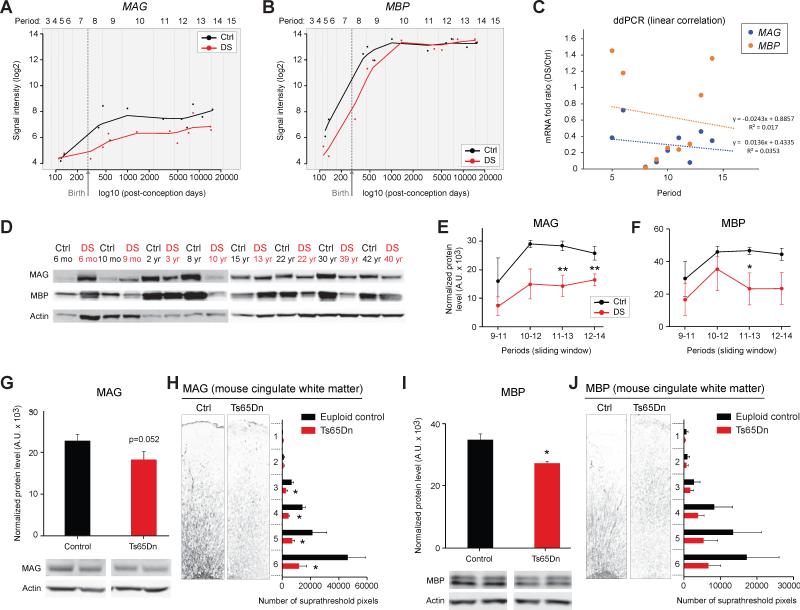
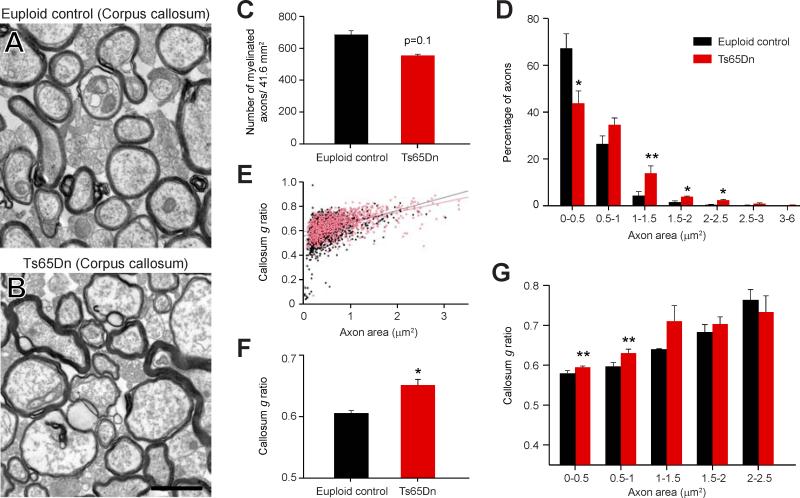
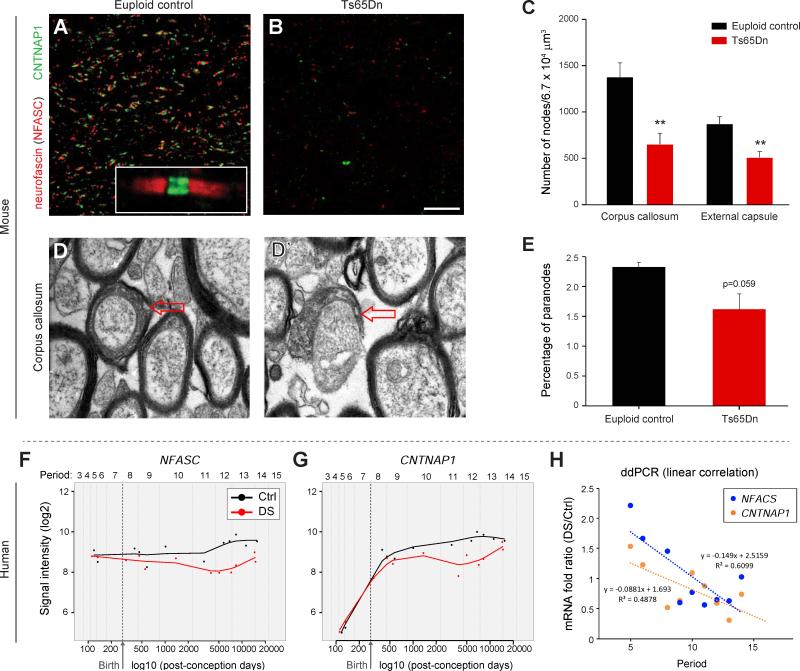
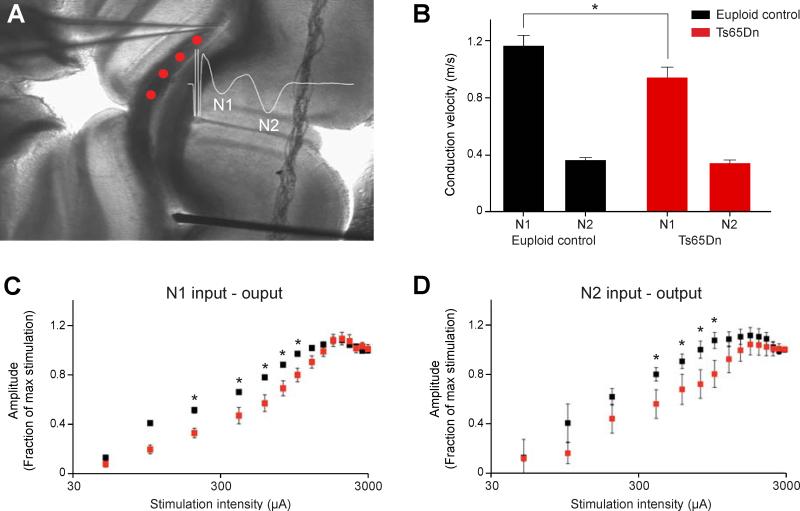
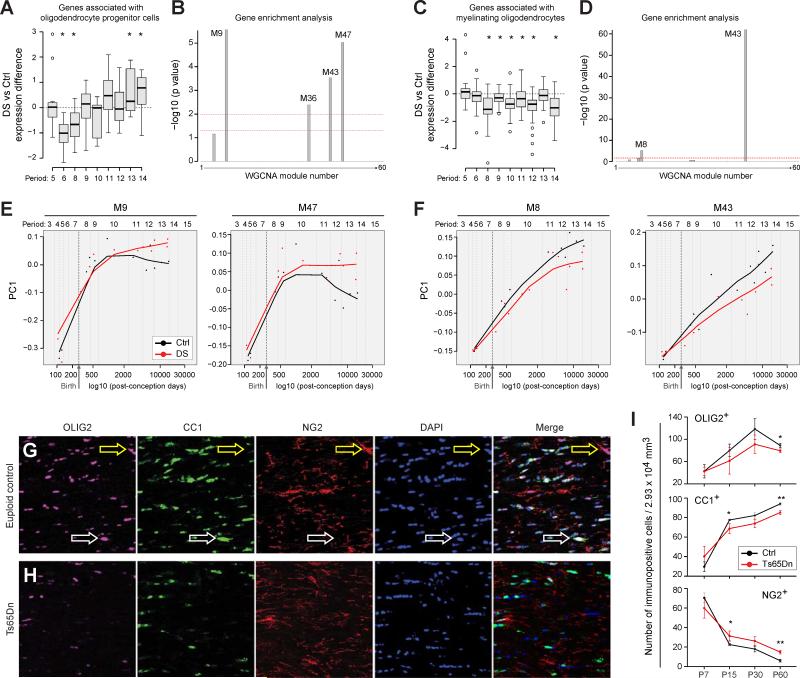
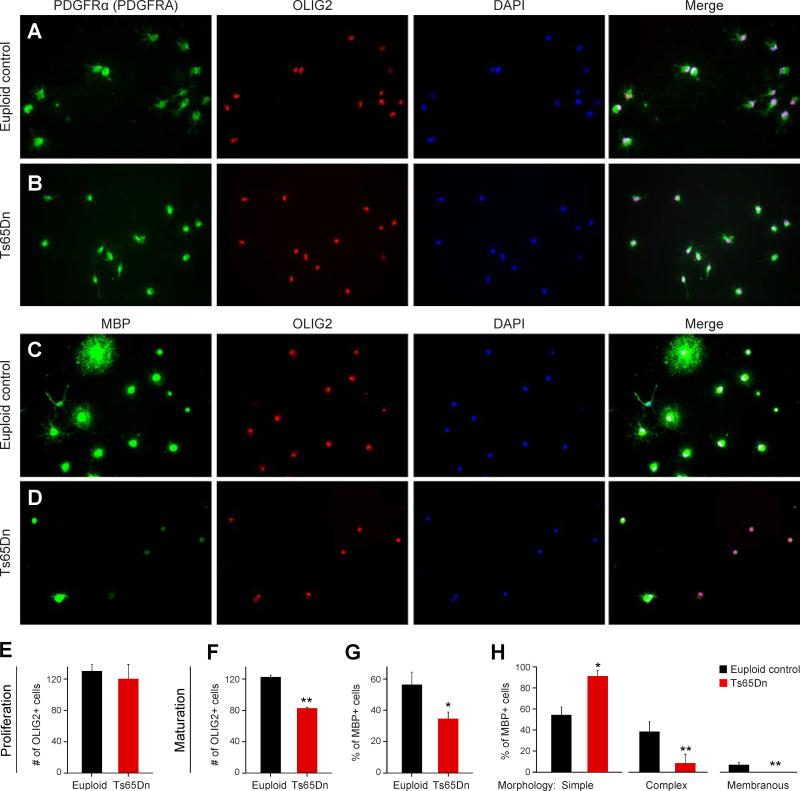
Trisomy 21, or Down syndrome (DS), is the most common genetic cause of developmental delay and intellectual disability. To gain insight into the underlying molecular and cellular pathogenesis, we conducted a multi-region transcriptome analysis of DS and euploid control brains spanning from mid-fetal development to adulthood. We found genome-wide alterations in the expression of a large number of genes, many of which exhibited temporal and spatial specificity and were associated with distinct biological processes. In particular, we uncovered co-dysregulation of genes associated with oligodendrocyte differentiation and myelination that were validated via cross-species comparison to Ts65Dn trisomy mice. Furthermore, we show that hypomyelination present in Ts65Dn mice is in part due to cell-autonomous effects of trisomy on oligodendrocyte differentiation and results in slower neocortical action potential transmission. Together, these results identify defects in white matter development and function in DS, and they provide a transcriptional framework for further investigating DS neuropathogenesis.

Keywords: brain development; gene expression; genomics; glia; neocortex; neurodevelopmental disorders; white matter.


Figures

Figure 1
Figure 1. Genes Dysregulated in DS Brains are Globally Distributed and Developmentally Dynamic
(A) The percentage of differentially expressed genes (DEX) on each chromosome indicating global disruptions in gene expression. (B) The number of genes on each chromosome that are DEX in Down syndrome (DS). Note that the majority of DEX genes are not located on HSA21. (C) The number of up-regulated (white shading) and down-regulated (gray shading) DEX genes per chromosome. (D and E) A permutation analysis of DEX genes in the dorsolateral prefrontal cortex (DFC) (D) and cerebellar cortex (CBC) (E) across 4 sliding windows corresponding to periods from mid-fetal development to adulthood. Periods of human brain development and adulthood are defined as previously described (Kang et al., 2011). Note that the number of DEX genes rises over development for DFC but not CBC. No CBC samples were available for periods 5 to 7.
Figure 2
Figure 2. A Co-Expression Module Enriched in Genes Associated with Oligodendrocyte Development and Myelination is Decreased over Development in DS
(A) Gene network analysis identifies distinct modules of co-expressed genes dysregulated in DS, including module (M) 43 that is significantly enriched in genes associated with oligodendrocyte development and myelination. Plots of relative expression of the PC1 of M43 over development in the DFC, primary visual cortex (V1C), hippocampus (HIP), and CBC, indicating higher expression in euploid control versus DS brain that increases in degree over development. (B) A heat map showing the expression of M43 genes in DFC (left panel) and CBC (right panel), which confirms and details the gene expression trajectories shown in (A). Note that a high proportion of mouse homologs of the M43 genes are expressed in mouse oligodendrocyte lineage cells (gene symbols are highlighted in red). (C) A network plot of M43 genes and their intramodular connections (cutoff, Pearson correlation > 0.7). 8 of the 10 hub genes (the top ten genes with highest intramodular connectivity; TMEM63A, MYRF, PLD1, RTKN, ASPA, OPALIN, ERBB3, EVI2A) are primarily expressed by mature oligodendrocytes and tightly correlated with other oligodendrocyte-associated M43 genes. Oligodendrocyte enriched genes are shown in red. Note their central position in the network, suggesting high intramodular connectivity. (D) The number of mouse homologs of M43 genes that are highly expressed in major cell types from mouse cerebral cortex. The majority of the M43 genes are highly expressed specifically in oligodendrocytes. Red bars denote the oligodendrocyte lineage; gray bars denote other cell lineages.
Figure 3
Figure 3. Expression of the Essential Myelin Components MAG and MBP is Diminished in Developing DS and the Ts65Dn Mouse Brains
(A) Log2 values of the array signal intensity in human euploid control (Ctrl) and DS DFC show that MAG expression is decreased from birth onwards (periods 8 to 14) in DS. Periods 5-9, p=0.28; periods 8-12, p=0.023; periods 9-13, p=0.025; periods 10-14, p=0.0024; all periods, p=0.014 (paired t-test). (B) Log2 values of the array signal intensity in human Ctrl and DS DFC show that MBP expression is decreased from mid-fetal development to early childhood (periods 5-9) in DS. Periods 5-9, p=0.078 (one tailed test, p=0.039); periods 8-12, p=0.192; periods 9-13, p=0.52; periods 10-14, p=0.72; all periods, p=0.10 (paired t-test). (C) ddPCR analysis of MBP and MAG expression in human Ctrl and DS DFC samples confirming decreased expression in developing DS brains. (D) Representative western blots for MAG and MBP in human Ctrl and DS DFC over development (DS samples in red type). (E and F) Sliding window analysis of MAG (E) and MBP (F) protein levels identify significant reductions in developing and adult DS brains. *, p≤0.03 (paired t-test). (G and H) Western blotting of neocortex tissue samples (n=10) (G) and immunostaining of the anterior cingulate cortex (n=9) (H) in postnatal day (P) 30 Ctrl and trisomic Ts65Dn mice identifies a reduction of MAG protein expression in Ts65Dn brains. *, p≤0.05; **, p≤0.001 (paired t-test). (I and J) Western blotting for MBP in the neocortex (n=3 pairs) (I) and immunostaining for MBP in P30 cingulate cortex (J) of Ctrl and Ts65Dn mice show a trend towards reduced expression of MBP in the white matter of Ts65Dn mice (n=3 pairs). *, p=0.009 (paired t-test).
Figure 4
Figure 4. Diminished Myelin Sheath Thickness in the Ts65Dn Corpus Callosum
(A and B) Representative electron micrographs of axon cross sections in the P60 euploid control (A) and Ts65Dn (B) corpus callosum. Scale bar = 1 μm. (C) Graph of the numbers of myelinated axons in euploid versus Ts65Dn revealing a trend towards a decrease in the number of myelinated axons in Ts65Dn mice. (D) Histogram indicating a decrease in the proportion of small diameter axons and an increase in the proportion of large diameter axons (>1 μm) in Ts65Dn mice. *, p≤0.05; #, p=0.058 (paired t-test). (E) Plot of g-ratios (y-axis) and the corresponding diameter for all axons assessed. Black dots = euploid control; red dots = Ts65Dn. (F) Bar graph showing there is a significant increase in the mean g-ratio in Ts65Dn mice indicating thinner myelin sheaths around Ts65Dn axons. *, p=0.011 (paired t-test). (G) Histogram indicating that the g-ratios of small diameter, but not large diameter axons, are higher in Ts65Dn mice. #, p≤0.08 (paired t-test).
Figure 5
Figure 5. Impaired Formation of Nodes of Ranvier in Ts65Dn Mice
(A) Representative image of nodes of Ranvier in P60 euploid control (Ctrl) corpus callosum identified by immunofluorescent labeling for the paranodal protein NFASC (red) and the internodal protein CNTNAP1 (green) which mark the node of Ranvier. (B) Representative image of immunostaining for NFASC (red) and CNTNAP1 (green) indicating there are fewer nodes of Ranvier in Ts65Dn mice. (C) Bar graph demonstrating reduced density of nodes of Ranvier in corpus callosum and external capsule in P60 Ts65Dn brain (n=3 pairs). **, p≤0.002 (paired t-test). (D and D’) Electron micrographs showing representative images of paranodes (arrows). (E) Quantification of paranodes reveals that they are reduced in P60 Ts65Dn corpus callosum (n=3 each). (F) Log2 values of the array signal intensity in human euploid Ctrl and DS DFC show that NFASC expression is decreased from birth onwards (periods 8 to 14) in DS. Periods 5-9, p=0.23; periods 8-12, p=0.016; periods 9-13, p=0.0092; periods 10-14, p=0.0022; all periods, p=0.0028 (paired t-test). (G) Log2 values of the array signal intensity for DFC expression of CNTNAP1 show that its expression is decreased from birth onwards (periods 8 to 14) in DS. Periods 5-9, p=0.41; periods 8-12, p=0.018; periods 9-13, p=0.017; periods 10-14, p=0.011; all periods, p=0.012 (paired t-test). (H) ddPCR analysis of human DFC samples confirming decreased expression of NFASC and CNTNAP1 from childhood onwards in DS.
Figure 6
Figure 6. Slower Axonal Conduction in Ts65Dn Corpus Callosum
(A) Experimental setup depicting the stimulating electrode (bottom) and recording electrode (top) within P30 corpus callosum of a coronal section. Compound action potentials (CAP) evoked by stimulation were recorded at multiple sites (red dots) to compute conduction velocity. Inset shows a representative example of an evoked CAP depicting the components arising from myelinated fibers (N1) and unmyelinated fibers (N2). (B) Bar plot showing that conduction velocities for myelinated fibers (N1), but not unmyelinated fibers (N2), were significantly slower in Ts65Dn corpus callosum (*, p=0.04, n=10 for N1; n=11 for N2). (C) The input-output relationship for myelinated fibers is right-shifted in Ts65Dn corpus callosum suggesting that this fiber type is less excitable (*, p<0.001 for N1 euploid n=5, Ts65Dn n=4). (D) The input-output relationship for unmyelinated fibers is right-shifted in Ts65Dn corpus callosum suggesting that this fiber type is less excitable (*, p≤0.007 for N2; euploid n=5, Ts65Dn n=4).
Figure 7
Figure 7. Oligodendrocyte Maturation is Impaired in DS
(A) Developmental changes in genes associated with oligodendrocyte progenitor cells expressed as ratio of DS vs. Ctrl. *p≤0.05 (paired t-test). (B) −log10 p-values of expression of oligodendrocyte progenitor cell-enriched genes in weighted gene co-expression network modules reveals significant enrichment in the M9, M36, M43 and M47 modules [y-axis = −log10 (p value)]. Lower dashed line corresponds to p = 0.05; upper dashed line corresponds to p = 0.01. (C) Developmental changes in genes associated with myelinating oligodendrocytes expressed as ratio of DS vs. Ctrl. *p≤0.05 (paired t-test). (D) −log10 p-values of enrichment analysis for expression of mature oligodendrocyte enriched genes in gene network co-expression modules demonstrating significant enrichment in modules M8 and M43 [y-axis = −log10 (p value)]. Lower dashed line corresponds to p = 0.05; upper dashed line corresponds to p = 0.01. (E) PC1 plots of the co-expression modules enriched in oligodendrocyte progenitor cell specific genes (M9 and M47) demonstrating that they are increased in DS and that the differences between Ctrl and DS samples increase over postnatal development. (F) PC1 plots enriched co-expression modules enriched in specific myelinating oligodendrocyte specific genes (M8 and M43) demonstrating that they are decreased in DS and that the differences between Ctrl and DS samples increase over postnatal development. (G) Representative immunofluorescent stains of P60 Ctrl corpus callosum for OLIG2 (purple), CC1 (green), NG2 (red), and nuclei (blue). Yellow arrows point to NG2-labeled OPCs and white arrows point to CC1-labeled mature oligodendrocytes. (H) Representative immunofluorescent stains of P60 Ts65Dn corpus callosum for OLIG2 (purple), CC1 (green), NG2 (red), and nuclei (blue). Fewer CC1-labeled mature oligodendrocytes are apparent. (I) The numbers of OLIG2 immuno-positive cells in the corpus callosum were counted in image volumes from P7-P60 (n=4 pairs at each age). There was a general trend of fewer OLIG2+ cells in the Ts65Dn white matter which becomes significant at P60. In addition, as a proportion of the total OLIG2+ population, the percentage of NG2+ oligodendrocyte progenitor cells is higher in Ts65Dn corpus callosum from P15-P60. In contrast, the percentage of mature CC1+ oligodendrocytes is reduced in Ts65Dn from P15-P60. *, p≤ 0.05; **, p≤ 0.005.
Figure 8
Figure 8. Impaired Maturation and Viability of Immunopurified Oligodendrocyte Progenitor Cells, In Vitro
(A) Representative micrographs of immunostaining for oligodendrocyte progenitor cells isolated from P7 euploid cortex and proliferated for 48 hours; PDGFRA (green), OLIG2 (red), and nuclei (blue). (B) Representative micrographs immunostaining for oligodendrocyte progenitor cells isolated from P7 Ts65Dn and proliferated for 48 hours; PDGFRA (green), OLIG2 (red), and nuclei (blue). (C) Representative micrographs of immunostaining for oligodendrocyte progenitor cells isolated from P7 euploid cortex and cultured in pro-maturation conditions for 72 hours; MBP (green), OLIG2 (red), and nuclei (blue). (D) Representative micrographs of immunostaining for oligodendrocyte progenitor cells isolated from P7 Ts65Dn cortex and cultured in pro-maturation conditions for 72 hours; MBP (green), OLIG2 (red), and nuclei (blue). (E) Graph indicating there were no differences between euploid control and Ts65Dn in the number OLIG2+ cells observed after 48 hours in proliferative conditions. (F) Graph indicating the number OLIG2+ cells was reduced by ~30% after 72 hours in pro-maturation conditions. (G) Graph indicating the percentage of OLIG2+ cells co-expressing MBP was reduced by ~40% after 72 hours in pro-maturation conditions. (H) Graph indicating a greater percentage of MBP+ cells from Ts65Dn mice cultured in pro-maturation conditions exhibited a simple morphology (<6 processes) than MBP+ euploid cells, which tended to have a more complex (≥ 6 processes) or membranous morphology. *, p≤ 0.05; **, p≤ 0.01 (unpaired Student's t-test).

References

    1. Abraham H, Vincze A, Veszpremi B, Kravjak A, Gomori E, Kovacs GG, Seress L. Impaired myelination of the human hippocampal formation in Down syndrome. Int J Dev Neurosci. 2012;30:147–158. - PubMed
    1. Ang ES, Jr., Haydar TF, Gluncic V, Rakic P. Four-dimensional migratory coordinates of GABAergic interneurons in the developing mouse cortex. J. Neurosci. 2003;23:5805–5815. - PMC - PubMed
    1. Bahn S, Mimmack M, Ryan M, Caldwell MA, Jauniaux E, Starkey M, Svendsen CN, Emson P. Neuronal target genes of the neuron-restrictive silencer factor in neurospheres derived from fetuses with Down's syndrome: a gene expression study. Lancet. 2002;359:310–315. - PubMed
    1. Bartzokis G. Acetylcholinesterase inhibitors may improve myelin integrity. Biol. Psychiatry. 2007;62:294–301. - PubMed
    1. Bartzokis G. Alzheimer's disease as homeostatic responses to age-related myelin breakdown. Neurobiol. Aging. 2011;32:1341–1371. - PMC - PubMed

Publication types

MeSH terms

Supplementary concepts