. 2016 Feb 29:6:22288.
doi: 10.1038/srep22288.

Identification of Meflin as a Potential Marker for Mesenchymal Stromal Cells

Affiliations

Identification of Meflin as a Potential Marker for Mesenchymal Stromal Cells

Keiko Maeda et al. Sci Rep. .

Abstract

Bone marrow-derived mesenchymal stromal cells (BM-MSCs) in culture are derived from BM stromal cells or skeletal stem cells. Whereas MSCs have been exploited in clinical medicine, the identification of MSC-specific markers has been limited. Here, we report that a cell surface and secreted protein, Meflin, is expressed in cultured MSCs, fibroblasts and pericytes, but not other types of cells including epithelial, endothelial and smooth muscle cells. In vivo, Meflin is expressed by immature osteoblasts and chondroblasts. In addition, Meflin is found on stromal cells distributed throughout the BM, and on pericytes and perivascular cells in multiple organs. Meflin maintains the undifferentiated state of cultured MSCs and is downregulated upon their differentiation, consistent with the observation that Meflin-deficient mice exhibit increased number of osteoblasts and accelerated bone development. In the bone and BM, Meflin is more highly expressed in primitive stromal cells that express platelet-derived growth factor receptor α and Sca-1 than the Sca-1-negative adipo-osteogenic progenitors, which create a niche for hematopoiesis. Those results are consistent with a decrease in the number of clonogenic colony-forming unit-fibroblasts within the BM of Meflin-deficient mice. These preliminary data suggest that Meflin is a potential marker for cultured MSCs and their source cells in vivo.


Figures

Figure 1
Figure 1. Meflin resided on the cell surface and was secreted by cultured fibroblasts and BM-MSCs.
(A) Microarray analysis for the identification of upregulated genes in superconfluent (SC) 3T3-L1 and NIH3T3 fibroblasts, but not HT-1080 fibrosarcoma cells. (B) The primary domain structure of Meflin (Islr) and its paralogue Linx (Islr2). Locations of epitopes for the generation of Meflin antibodies (19 mer, 23 mer and 25 mer) are also shown. Numbers in parentheses indicate the number of amino acid residues. (C) Meflin was expressed specifically in contact-inhibited and superconfluent 3T3-L1 and C3H10T1/2 cells. kDa, kilodaltons. (D–F) Meflin protein was expressed in cultured dermal fibroblasts and BM-MSCs, depending on cell confluency. For the depletion of Meflin, cells were infected with retrovirus encoding the indicated shRNA followed by selection for puromycin. Note that Meflin was secreted into the medium (E). In the lower panel of (F), Meflin mRNA was measured by qPCR every two days after plating 2 × 105 BM-MSCs in 3.5-cm dishes. TCL, total cell lysates. (G) Meflin identified as a GPI-anchored protein. Proteins extracted from fibroblasts by Triton X-114 in the presence or absence of phosphatidylinositol-specific phospholipase C (PI-PLC) were tested by Western blot analysis, where CD59 was used as a positive control. The red box indicates GPI-anchored Meflin that is sensitive to PI-PLC treatment. D, detergent phase; A, aqueous phase. (H) 293 cells that stably expressed mouse (m) Meflin (lower panel) and control cells (upper panel) were stained with the anti-Meflin antibody. (I) Isolation of cell surface proteins by biotin labeling from control and 293-Meflin cells, showing that Meflin was predominantly expressed on the cell surface. (J) T7-tagged Meflin was cotransfected with Flag-tagged Meflin into COS7 cells, followed by immunoprecipitation by anti-Flag antibody and Western blot analysis with indicated antibodies, showing that Meflin formed an oligomer. (K) Meflin, a cell surface oligomeric protein, was also secreted by unknown mechanisms.
Figure 2
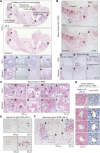
Figure 2. Expression pattern of Meflin in mouse tissues.
(A) ISH analysis with Meflin antisense (AS) and control (Sense) probes. Box regions are magnified in adjacent panels (a–h). The data show the expression of Meflin in the cartilage primordia of nasal septum (a,e), temporal bone, costal cartilage, vertebra (b,f), and femur (c,g) in E18.5 embryos. Neural tissues such as pallium are almost negative for Meflin, with an exception that the hippocampus (HP) shows marginal expression of Meflin (d,h). (B) Meflin expression in the knee joint in adult (P56) mice. Meflin was expressed in the resting and proliferative zone (RZ/PZ), but not hypertrophic zone (HZ) of the growth plate (GP) (b,e). Meflin was also expressed in cells condensing near the periosteum (red arrowheads) (c,f). No Meflin expression was detected in mature chondrocytes in the articular cartilage (a,d) or in osteocytes in the compact bone (c,f). Red box regions (BM) are magnified and described in (C). M, metaphysis. (C) The magnification of the BM region in (B) shows Meflin expression in cells that are sporadically distributed in the BM. The majority of Meflin+ cells (arrows) was detected in the perisinusoidal region, whereas some were in the peritrabecular region. T, trabeculae; S, sinusoids. (D) ISH for Meflin (left) and immunohistochemistry (IHC) for Lepr (right) on serial sections from the BM showed partial coexpression of Meflin and Lepr in stromal cells around the sinusoids (red arrowheads). (E,F) Meflin expression in adipose tissues. Meflin+ cells were sparsely detected in the adipose tissues of inguinal (D) and mammary (E) fat pad regions (arrows). Note that some of the Meflin+ cells were detected in perivascular regions (red arrowheads) and periductal regions in the inguinal fat pad and the mammary fat pad, respectively. C, capillaries; D, milk duct.
Figure 3
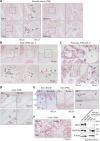
Figure 3. Meflin expression in perivascular, perineurium, and meningothelial cells, and reticular fibroblasts.
(A) Meflin expression in subendothelial pericytes and perivascular fibroblasts (arrows) around the capillaries (C) and perineurium cells (arrowheads) around the nerve (N) among the muscular bundles. (B) Meflin expression in pericytes in the subarachnoid cavity (arrows) and meningothelial cells (arrowheads) in the meninges (M) in the adult brain. Note that Meflin expression was neither found in the epithelial cells in the choroid plexus (CP) nor neurons in the brain parenchyma. (C) In the pancreas, Meflin was expressed in perivascular and periductal fibroblasts, but not in the constituents of the islands of Langerhans (IL) nor the acini (A). D, interlobular duct; C, capillaries. (D) In the abdominal aorta, Meflin was expressed in fibroblasts (arrows) in the adventitia (Ad). Note that Meflin was not expressed in smooth muscle cells in the tunica media (M), despite the weak expression of Meflin in some cells found in the outer layer of the tunica media (arrowheads). (E) Meflin expression in the skin. In the skin of the back of mouse embryos (left panels), Meflin was expressed in fibroblasts (arrows) in and around the subcutaneous muscle layer (M) but was very rare in the dermis and subcutaneous tissues (DS) and the epidermis (E). In adult skin (right panels), Meflin expression was detected in pericytes (arrows in the magnified region) and fibroblasts (arrowhead) around the subcutaneous muscle. (F) Meflin expression in the colon. Meflin was detected in reticular fibroblasts (arrows) in the lamina propria (LP) in the mucosa. E, epithelium; MM, muscularis mucosa. (G) Western blot analysis shows Meflin expression in superconfluent (SC), but not 90% confluent, primary pericytes isolated from the placenta. Dermal fibroblasts and BM-MSCs serve as positive controls.
Figure 4
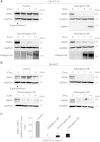
Figure 4. Downregulation of Meflin in the differentiation of MSCs.
(A,B) Western blot analysis showed the downregulation of Meflin one day after the initiation of adipogenic, chondrogenic, and osteogenic differentiation of C3H10T1/2 (A) and BM-MSCs (B). FABP4, fatty acid binding protein-4. (C) qPCR showed the downregulation of mRNA for Meflin in the trilineage differentiation of C3H10T1/2 cells. *P < 0.05 compared with control.
Figure 5
Figure 5. Meflin regulated undifferentiated state of C3H10T1/2 cells and BM-MSCs.
(A) Forced exogenous expression of Meflin suppressed the expression of Sox9 protein in chondrogenic differentiation (left panel) and Runx2 and osteopontin proteins in osteogenic differentiation (right panel) in C3H10T1/2 cells. (B) Forced expression of Meflin, but not Decorin (control), led to the downregulation of basal expression of the Sox9 gene in undifferentiated C3H10T1/2 cells (left panel). In cells that underwent osteogenic differentiation (right panel), Meflin suppressed alkaline phosphatase (ALP) activity and calcium deposit as determined by Alizarin red staining. (C) Meflin-depletion led to the upregulation of the basal expression of Sox9 protein in BM-MSCs (top panel) and C3H10T1/2 cells (lower panel). (D) Meflin-depletion upregulated the activity of the human Sox9 promoter in BM-MSCs, as determined by luciferase reporter assay. *P < 0.05 compared with control. A.U., arbitrary units. (E) qPCR assay showed that Meflin-depletion led to the upregulation of Aggrecan and Collagen IIa, the hallmarks of chondrogenic differentiation, in C3H10T1/2 cells. *P < 0.05 compared with control. (F) No apparent effect of Meflin-depletion on adipogenic differentiation in 3T3-L1 cells. Note that Meflin expression was specifically detected in superconfluent (SC) cells that underwent rapid downregulation by adipogenic differentiation. (G) Schematic illustration of our preliminary hypothesis on the role of Meflin in determining the undifferentiated state of cultured MSCs. Meflin is expressed in undifferentiated MSCs to suppress the induction of Sox9 and Runx2 expression. At present, the role of Meflin in adipogenic differentiation remains undetermined. (H) Gradual decrease of Meflin expression depending on the passage number in BM-MSCs.
Figure 6
Figure 6. Meflin function was distinct from other members of the LIG family or proteins.
(A) A phylogenetic tree showing the evolution of representative members of the LIG family of proteins. The scale bar indicates the rate of amino acid substitutions per site. The interacting proteins for each member of the LIG family, many of which are RTKs, are also shown. (B) Interaction of Meflin with PDGFRα (left panel) and EGFR (right panel). 293FT cells were transfected with the indicated plasmids, followed by immunoprecipitation (IP) and Western blot analysis. (C) No apparent effect of Meflin-depletion in PDGF signaling in dermal fibroblasts. Lysates from control and Meflin-depleted cells stimulated with recombinant rat PDGF-BB for indicated times were subjected to Western blot analysis using the indicated antibodies. (D) Meflin regulated nuclear localization of the FoxO1 transcription factor. Western blots were used to examine whole lysates (left panel) and nuclear fractions (right panel) isolated from C3H10T1/2 cells transduced with retroviruses expressing luciferase and Meflin shRNAs. (E) C3H10T1/2 cells were transduced with retroviruses expressing GFP (control) and Meflin, followed by Western blot analysis. Overexpression of Meflin suppressed the nuclear localization of FoxO1, without apparently affecting its phosphorylation. Histone-H3 is a marker for nuclear proteins.
Figure 7
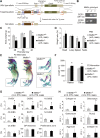
Figure 7. Meflin-deficiency led to aberrant development of bones.
(A) A schematic illustration showing the strategy for targeting the Meflin (islr) gene, which was designed by the EuMMCR. Note that exon 2 of the Meflin (islr) gene encodes a whole open reading frame (ORF). The sites for PCR primers for genotyping are also shown. (B) A representative data of genotypic PCR shows the complete deletion of the WT alleles in Meflin−/− mice. (C,D) The weights of whole bodies and the indicated organs harvested from P56 male mice were measured, indicating growth retardation in Meflin−/− mice. In (D), the weight of each organ was normalized by body weight (n = 3). *P < 0.05 compared with WT mice. (E) Representative images of the skeletons of a Meflin−/− P2 male mouse and its WT littermate are shown. Boxed areas are magnified in adjacent panels. (F) Quantification of the lengths of the radii and tibiae from WT and Meflin−/− P2 littermates (n = 3). *P < 0.05 compared with WT mice. (G) Bone histomorphometric analyses of the secondary spongiosa area and the GP of tibiae from WT and Meflin−/− P70 littermates (n = 4 and 5, respectively). Note a significant increase in osteoblast number/bone surface (N.Ob/BS), osteoblast surface/bone surface (Ob.S/BS), osteoid surface/bone surface (OS/BS) and osteoid volume/bone volume (OV/BV) in Meflin−/− mice. *P < 0.05 compared with WT mice. No apparent differences were seen in the thickness of the GP and the proliferative zone between WT and Meflin−/− P70 mice. (H) Quantitation of the expression of osteogenic and chondrogenic genes in the tibiae from WT and Meflin−/− P70 mice by qPCR (n = 3). *P < 0.05 compared with WT mice. The data are presented as the fold-increase compared with WT mice.
Figure 8
Figure 8. Meflin-deficiency reduced the capacity of non-hematopoietic BM cells to generate CFU-Fs.
(A) Meflin expression in BM-MSCs isolated from the BM of wild-type and Meflin−/− P56 mice was monitored by Western blot analysis. (B) Representative images of CFU-Fs produced from CD45TER119 BM cells from wild-type and Meflin−/− P56 mice stained with the Giemsa solution (top panel). The images for individual representative colonies are also shown (lower panel). (C) Lower CFU-F frequency in Meflin−/− CD45TER119 BM cells. The number of CFU-F for 2 × 103 initially plated wild-type and Meflin−/− CD45TER119 BM cells in 10-cm dishes was calculated and quantified (n = 3). *P < 0.05 compared with wild-type mice. (D) Representative flow cytometric profile of non-hematopoietic CD45Ter119 BM cells stained for PDGFRα (upper right) and PDGFRβ (lower right) and Sca-1. The cells were isolated from the femurs and tibiae of 8- to 10-week-old mice with collagenase treatment. The percentage of each cell population is shown in the panels. FSC, forward scatter; SSC, side scatter. (E) Relative mRNA expression levels of Meflin, Lepr and Cxcl12 was assessed by qPCR for each gated population from CD45Ter119 BM cells. The data for each mRNA were normalized against GAPDH control. (F) Quantification of the number of each type of peripheral blood cell from 7-week-old WT and Meflin−/− mice.

Similar articles

Cited by

References

    1. Friedenstein A. J., Chailakhjan R. K. & Lalykina K. S. The development of fibroblast colonies in monolayer cultures of guinea-pig bone marrow and spleen cells. Cell Tissue Kinet 3, 393–403 (1970). - PubMed
    1. Bianco P. “Mesenchymal” stem cells. Annu Rev Cell Dev Biol 30, 677–704 (2014). - PubMed
    1. Caplan A. I. Mesenchymal stem cells. J Orthop Res 9, 641–650 (1991). - PubMed
    1. Nombela-Arrieta C., Ritz J. & Silberstein L. E. The elusive nature and function of mesenchymal stem cells. Nat Rev Mol Cell Biol 12, 126–131 (2011). - PMC - PubMed
    1. Bianco P. & Robey P. G. Skeletal stem cells. Development 142, 1023–1027 (2015). - PMC - PubMed

Publication types

MeSH terms