. 2016 Mar 24;165(1):165-179.
doi: 10.1016/j.cell.2016.01.020. Epub 2016 Feb 25.

A Stringent Systems Approach Uncovers Gene-Specific Mechanisms Regulating Inflammation

Affiliations

A Stringent Systems Approach Uncovers Gene-Specific Mechanisms Regulating Inflammation

Ann-Jay Tong et al. Cell. .

Abstract

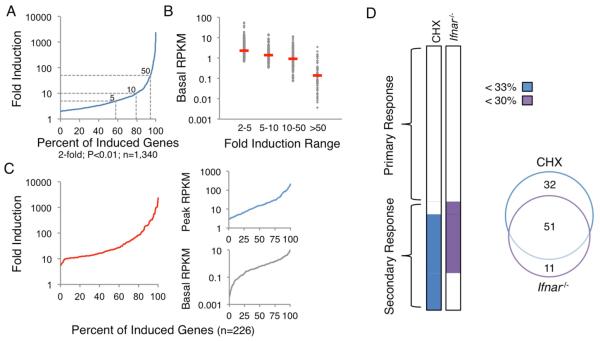
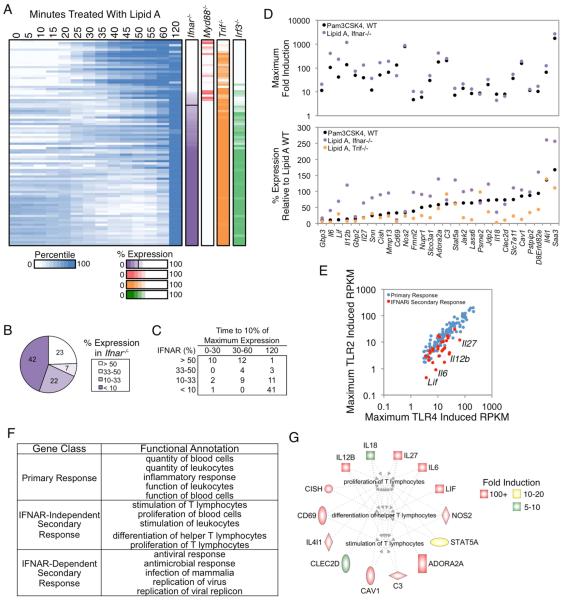
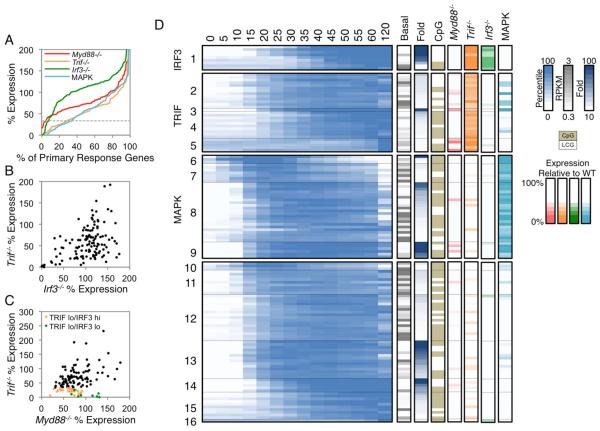
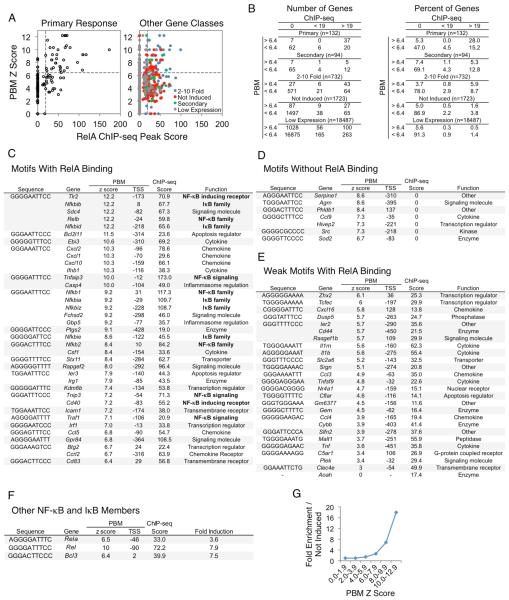
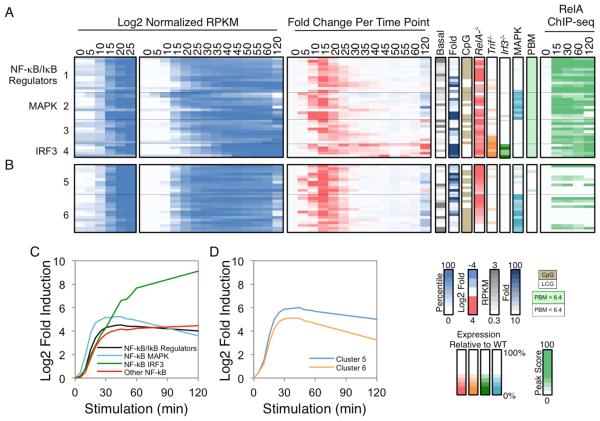
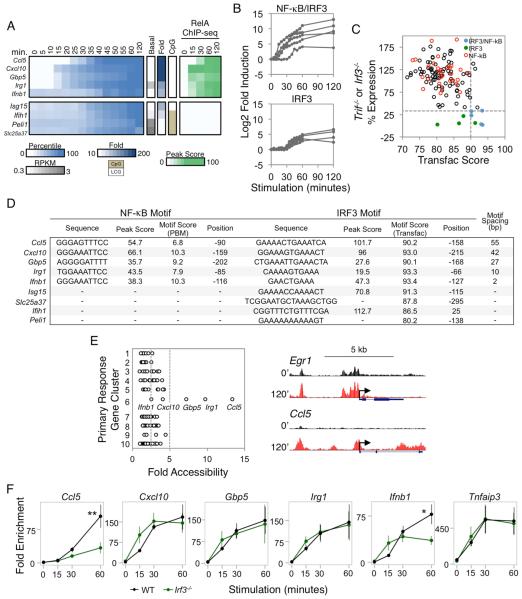
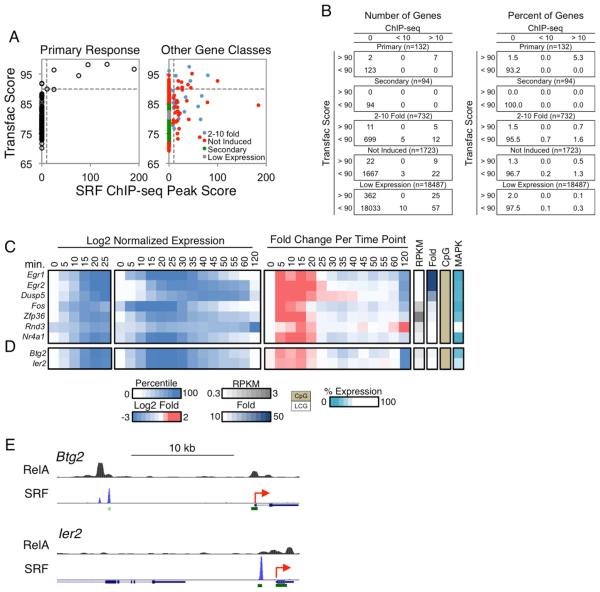
Much has been learned about transcriptional cascades and networks from large-scale systems analyses of high-throughput datasets. However, analysis methods that optimize statistical power through simultaneous evaluation of thousands of ChIP-seq peaks or differentially expressed genes possess substantial limitations in their ability to uncover mechanistic principles of transcriptional control. By examining nascent transcript RNA-seq, ChIP-seq, and binding motif datasets from lipid A-stimulated macrophages with increased attention to the quantitative distribution of signals, we identified unexpected relationships between the in vivo binding properties of inducible transcription factors, motif strength, and transcription. Furthermore, rather than emphasizing common features of large clusters of co-regulated genes, our results highlight the extent to which unique mechanisms regulate individual genes with key biological functions. Our findings demonstrate the mechanistic value of stringent interrogation of well-defined sets of genes as a complement to broader systems analyses of transcriptional cascades and networks.


Figures

Figure 1
Figure 1. Properties of the Lipid A-Induced Transcriptional Cascade
Chromatin-associated transcripts from BMDMs stimulated with lipid A were analyzed by RNA-seq. (A) The distribution of maximum fold induction values over the 2-hr stimulation period is shown for the 1,340 significantly induced (2-fold, p<0.01) and expressed (3 RPKM) genes. With multiple hypothesis testing, two weakly induced genes exhibited q values >0.01. The dashed gray lines represent 5-, 10-, and 50-fold induction thresholds. (B) The 1,340 induced genes were grouped into bins, with basal RPKMs shown for each bin and red dashes indicating median RPKMs. (C) The distributions of maximum fold inductions (left), peak RPKMs (top right), and basal RPKMs (bottom right) are shown for the 226 genes selected for analysis. (D) The 226 genes were separated into PRG and SRG groups on the basis of their expression in CHX-treated and Ifnar−/− BMDMs. Genes were classified as SRGs if they were expressed <33% in CHX or <30% in Ifnar−/− samples. The Venn diagram indicates the number of genes affected by CHX treatment, the absence of IFNAR, or both.
Figure 2
Figure 2. Analysis of IFNAR-Independent and -Dependent SRGs
(A) Activation kinetics are shown for SRGs from BMDMs stimulated at 5-min intervals from 0-60 min, with an additional 120-min time point. Shades of blue indicate percentile values. Genes were sorted on their maximum percent expression in Ifnar−/− BMDMs relative to WT BMDMs (purple column). The maximum percent expressions in Myd88−/−, Trif−/−, and Irf3−/− are shown to the right. See also Figure S1. (B) The distribution of genes in IFNAR-dependence bins based on their expression in Ifnar−/− BMDMs is shown. (C) The time point at which each SRG in the IFN-dependence bins reached 10% of its maximum expression is indicated. (D) The maximum fold induction of the 29 IFNAR-independent genes in PAM-stimulated (black) and lipid A-stimulated Ifnar−/− (purple) BMDMs is shown (top), along with the percent expression of these genes in PAM-stimulated (black), lipid A-stimulated Ifnar−/− (purple), and lipid A-stimulated Trif−/− (orange) BMDMs relative to WT BMDMs stimulated with lipid A (bottom). IFNAR-independent genes were defined as those induced >10-fold and expressed >3 RPKM in the absence of IFNAR signaling, or expressed at greater than 50% of WT in Ifnar−/− BMDMs stimulated with lipid A or WT BMDMs stimulated with PAM. (E) A scatterplot comparing the maximum RPKMs in PAM-stimulated BMDMs (y-axis) and lipid A-stimulated BMDMs (x-axis) for PRGs (blue) and the IFNAR-independent SRGs (red) is shown. (F) Ingenuity Pathway Analysis was used to identify the top functional annotations for PRGs and the IFNAR-dependent and -independent SRGs. (G) The IFNAR-independent genes involved in the proliferation, differentiation, and activation of T lymphocytes (Ingenuity Pathway Analysis) are colored based on their fold induction in Ifnar−/− BMDMs.
Figure 3
Figure 3. Properties of PRGs
(A) The distribution of the maximum percent expressions in Myd88−/− (red), Trif−/− (orange), Irf3−/− (green), and MAP kinase inhibitor-treated (light blue) BMDMs stimulated with lipid A are shown for the 132 PRGs. The horizontal dashed grey line indicates the 33% expression threshold. (B-C) The percent expression of each PRG is shown in Trif−/− versus Irf3−/− cells (B), or in Trif−/− versus Myd88−/− cells (C). TRIF lo (<33% relative to WT) IRF3 hi (>33% relative to WT) genes are in orange, and TRIF lo (<33% relative to WT) IRF3 lo (<33% relative to WT) genes are in green. (D) Activation kinetics are shown (log2-normalized and mean-centered RPKMs) for the PRGs in BMDMs stimulated for 5-min intervals between 0-60 min, and for 120 min. The PRGs were broadly classified based on their expression in Myd88−/− (red), Trif−/− (orange), Irf3−/− (green), and MAP kinase inhibitor-treated (light blue) BMDMs with the following order: IRF3-dependent (cluster 1; <33% in both Trif−/− and Irf3−/−), TRIF-dependent (cluster 2-5; <33% in Trif−/− only), and MAPK-dependent (cluster 6-9; <33% in MAPK inhibitor-treated samples). The remaining PRGs were not dependent on any perturbation examined (cluster 10-16; >33% in all perturbed datasets). The genes in each class were subclustered (k-means) on their expression kinetics. The properties of each gene are shown to the right of the heat map: basal expression value (grey), fold induction magnitude (blue), promoter CpG-island (beige), and the maximum percent expression in Myd88−/− (red), Trif−/− (orange), Irf3−/− (green), and MAPK inhibitor-treated (light blue) BMDMs. See also Figure S2 and S3.
Figure 4
Figure 4. NF−κB Interactions at the Promoters of Defined Gene Classes
(A) PBM Z scores of p50:RelA (y-axis) and RelA ChIP-seq peak scores (x-axis) in the promoters of the PRGs (left) and all remaining genes in the genome (right) were plotted. The remaining genes were assigned to 2-10-fold induced (blue), not induced (red), SRG (green), or low expression (grey) categories. The horizontal dashed line indicates the PBM Z score threshold (6.4), and the vertical dashed line indicates the ChIP-seq peak score threshold (19). (B) Tables are shown indicating the distribution of genes from panel (A) for both numbers (left) and percentages (right) of genes. (C-F) Tables are shown indicating the best matching κB motif in each promoter (column 1), the gene name (column 2), the PBM p50:RelA Z score (column 3), the position of the motif relative to the TSS (column 4), the RelA ChIP-seq peak score (column 5), and either the function or fold induction (column 6). This information is included for the PRGs with: (C) strong κB motifs and strong RelA binding, (D) strong κB motifs that do not support RelA binding, (E) weak κB motifs and strong RelA binding, and (F) other NF-κB and IκB family members. (G) A line graph is shown indicating the p50:RelA motif Z score enrichment in the promoters of the PRGs relative to the promoters of uninduced genes. See also Figure S5.
Figure 5
Figure 5. Kinetic and Functional Analysis of Putative NF−κB Target Genes
(A) The 37 PRGs containing strong NF−κB promoter motifs and RelA ChIP-seq promoter peaks were grouped into four categories: those that encode NF-κB/IκB family members and regulators (group 1), those that exhibit either MAPK or IRF3 dependence (groups 2 and 4), and the remaining genes (group 3). Normalized expression values from 0-25 min (left panel) and 0-120 min (second panel), and the fold change relative to the previous time point (third panel) are shown. To the right of the heatmaps, the basal expression values, fold induction magnitudes, promoter CpG contents, and expression values in Rela−/−, Trif−/−, Irf3−/−, and MAPK-inhibited BMDMs are shown. The presence of a p50:RelA motif based on PBM datasets and the RelA ChIP-seq binding peak scores are indicated in the far right panels. See also Figure S4. (B) Examples of PRGs that exhibited similar activation kinetics and/or RelA dependence to the 37 genes with strong NF−κB motifs and ChIP-seq peaks are shown. See also Figure S4. (C) The average activation kinetics of the NF-κB subgroups is shown as log2 fold inductions relative to basal during the 120-min lipid A treatment period. (D) The average activation kinetics of the two additional clusters from Figure 5B (Cluster 5 and 6) are shown.
Figure 6
Figure 6. Analysis of IRF3 Target Genes
(A) PRGs exhibiting IRF3 dependence (<33% expression in both Irf3−/− and Trif−/− macrophages) were separated based on the presence or absence of strong NF-κB promoter motifs and RelA ChIP-seq peaks. Colors indicate the percentile of the relative expression. Also shown are the basal RPKM, fold induction magnitude, and promoter CpG content. The rightmost heatmap indicates the RelA ChIP-seq binding peak scores. (B) The fold induction for each IRF3-dependent gene is shown over the 2-hr time period, grouped based on their additional requirement for NF-κB. (C) For each PRG, the higher maximum percent expression from either Trif−/− or Irf3−/− BMDMs (y-axis) was assessed against the best scoring IRF3 motif (x-axis) within the promoter based on the IRF Transfac PWM. The five IRF3/NF-κB genes are shown in blue, and the four IRF3 genes are shown in green. The PRGs containing strong NF-κB promoter motifs and RelA ChIP-seq peaks are shown in red. The horizontal dashed line indicates the expression threshold (33%), and the vertical dashed line indicates the Transfac threshold (90). (D) For each IRF3-dependent gene, the IRF3 and RelA:p50 binding sites (for the IRF3/NF-κB groups of genes) were identified. The spacing between the NF-κB and IRF3 motifs is indicated at the right. The strengths of the κB motifs are represented by PBM Z scores, and the strengths of the IRF motifs are represented by PWM Transfac scores. For the four genes lacking NF-κB motifs, the best IRF promoter motif is shown. (E) Left: The fold increase in ATAC-seq RPM at gene promoters (x-axis) is shown according to the PRG clusters 1-10 (y-axis) where the cluster designations denote 1:SRF, 2:MAPK, 3:MAPK/NF-κB, 4:NF-κB/Iκβ regulator, 5:NF-κB/Other, 6:NF-κB/IRF3, 7:NF-κB/Enhancer, 8:TRIF, 9:IRF3, 10:Unknown (see also Figure S6). The vertical dashed lines indicate the 2.5- and 5-fold cutoffs. Right: UCSC Genome Browser tracks of chromatin accessibility in resting and 120-min stimulated BMDMs at the promoters of two genes from different gene clusters are shown. (F) RelA ChIP-qPCR was performed using WT and Irf3−/− BMDMs stimulated with lipid A. The relative enrichment of RelA binding was normalized to a negative control region. The RelA binding kinetics at the promoters of the 5 NF-κB/IRF3 genes were compared to the Tnfaip3 promoter as a control (far right). The data shown represent an average of 3 biological replicates. Error bars indicate the standard error. ** P <0.01; * P <0.05.
Figure 7
Figure 7. Analysis of SRF Target Genes
(A) Scatterplots comparing the Transfac PWM scores of SRF binding motifs (y-axis) versus the SRF ChIP-seq peak scores (x-axis) in the promoters (−500 to +150) of the PRGs (left) and all remaining genes in the genome (right) is shown. The genes in the latter graph were divided into categories as in Figure 4A. The horizontal and vertical dashed lines indicate the SRF motif (90) and ChIP-seq peak (10) thresholds. (B) Tables are shown indicating the distribution of genes from panel (A), for both numbers (left) and percentages (right) of genes. (C) Log2 normalized expression values from 0-25 min (first panel), 0-120 min (second panel), and the fold induction relative to the expression level at the previous time point (third panel) are shown for the seven putative SRF target genes. To the right are columns indicating the basal expression level, fold induction magnitude, promoter CpG content, and MAPK dependence for each gene. (D) Two genes that exhibited similar activation kinetics as the putative SRF target genes are shown, with the same layout as in Figure 7C. (E) The two genes from panel (D) were examined on UCSC Genome Browser to identify distal SRF binding peaks. RelA binding peaks were also examined for these genes. The TSSs of the genes are indicated as red arrows, and the green rectangles indicate CpG islands. See also Figures S6 and S7.

Comment in

References

    1. Agalioti T, Lomvardas S, Parekh B, Yie J, Maniatis T, Thanos D. Ordered Recruitment of Chromatin Modifying and General Transcription Factors to the IFN-β Promoter. Cell. 2000;103:667–678. - PubMed
    1. Amit I, Garber M, Chevrier N, Leite AP, Donner Y, Eisenhaure T, Guttman M, Grenier JK, Li W, Zuk O, et al. Unbiased reconstruction of a mammalian transcriptional network mediating pathogen responses. Science. 2009;326:257–263. - PMC - PubMed
    1. Barish GD, Yu RT, Karunasiri M, Ocampo CB, Dixon J, Benner C, Dent AL, Tangirala RK, Evans RM. Bcl-6 and NF-κB cistromes mediate opposing regulation of the innate immune response. Genes Dev. 2010;24:2760–2765. - PMC - PubMed
    1. Benjamini Y, Hochberg Y. Controlling the False Discovery Rate: A Practical and Powerful Approach to Multiple Testing. J. R. Stat. Soc. 1995;57:289–300.
    1. Bhatt DM, Pandya-Jones A, Tong AJ, Barozzi I, Lissner MM, Natoli G, Black DL, Smale ST. Transcript dynamics of proinflammatory genes revealed by sequence analysis of subcellular RNA fractions. Cell. 2012;150:279–290. - PMC - PubMed

Publication types