. 2016 Mar 24;165(1):100-110.
doi: 10.1016/j.cell.2016.01.021. Epub 2016 Feb 25.

Cytotoxic T Cells Use Mechanical Force to Potentiate Target Cell Killing

Affiliations

Cytotoxic T Cells Use Mechanical Force to Potentiate Target Cell Killing

Roshni Basu et al. Cell. .

Abstract

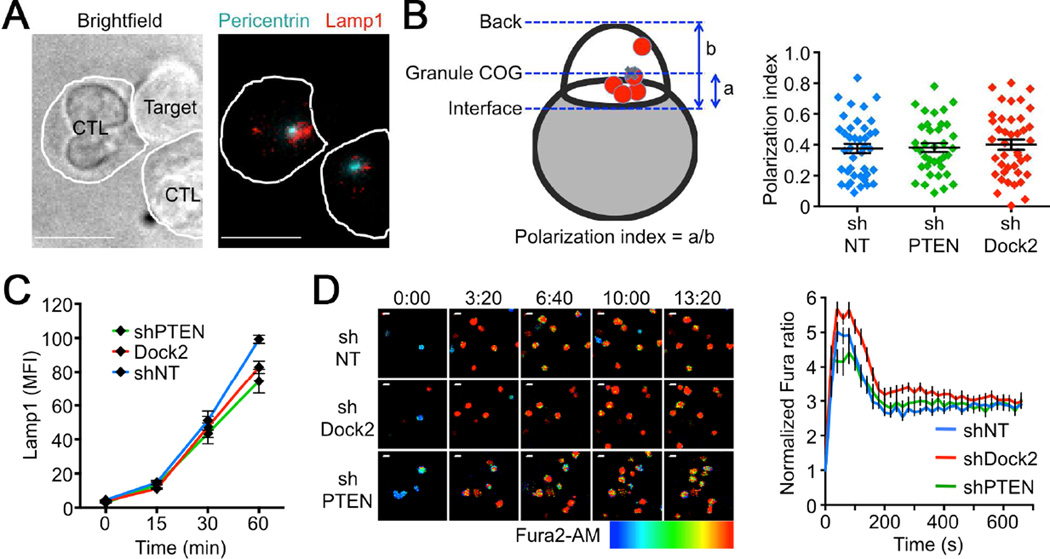
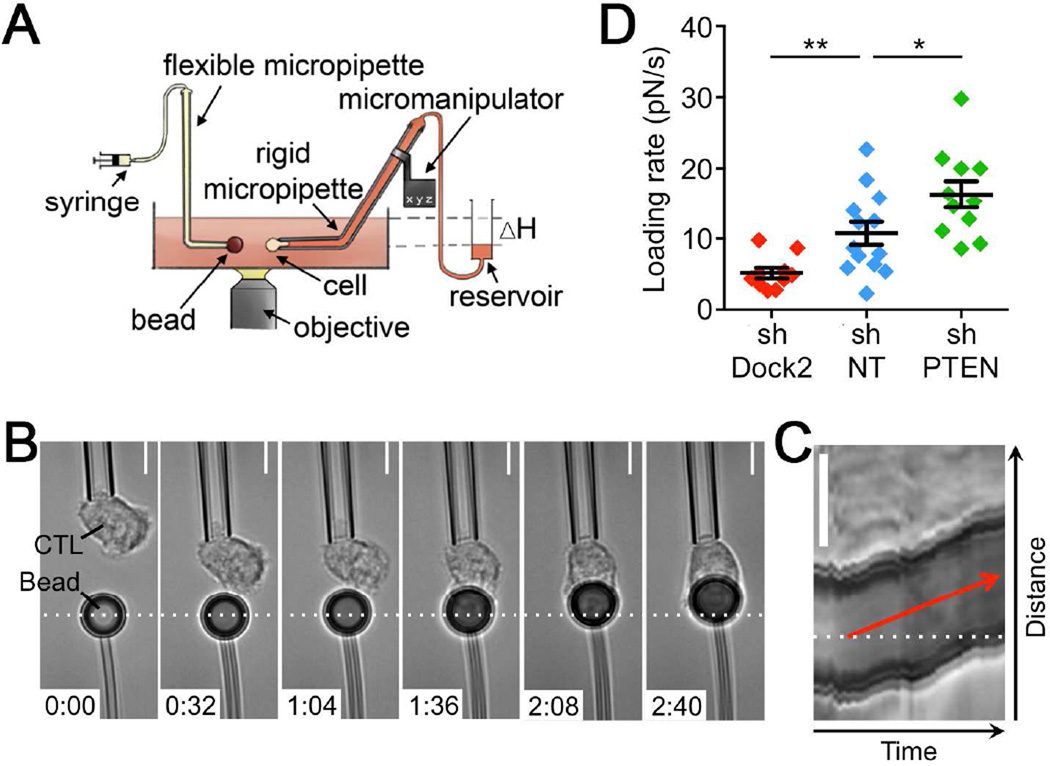
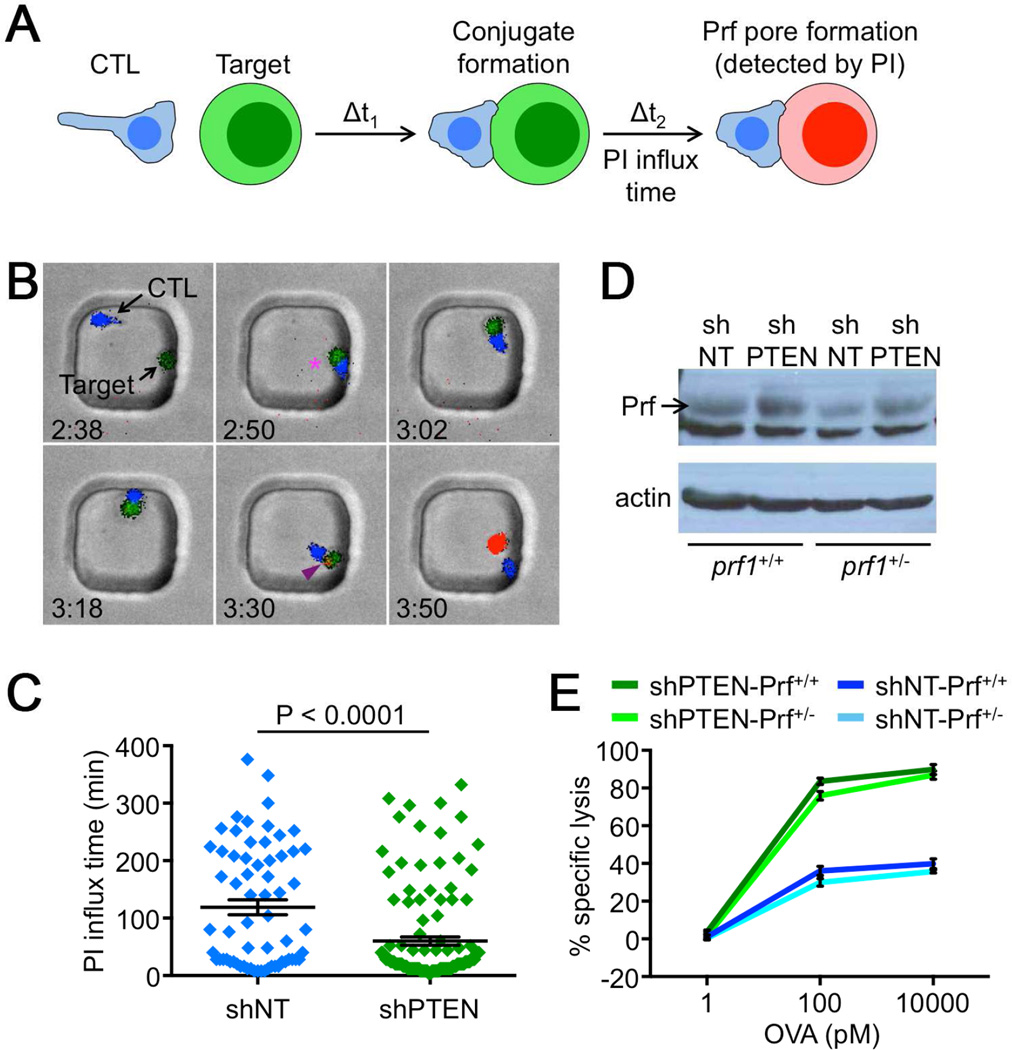
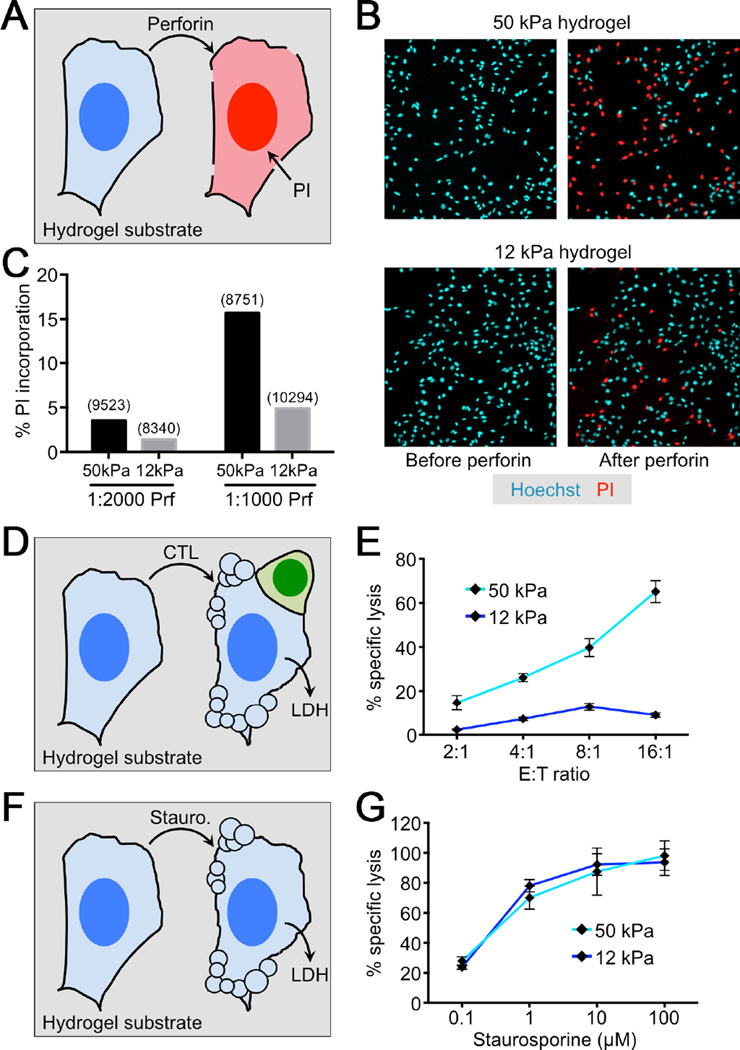
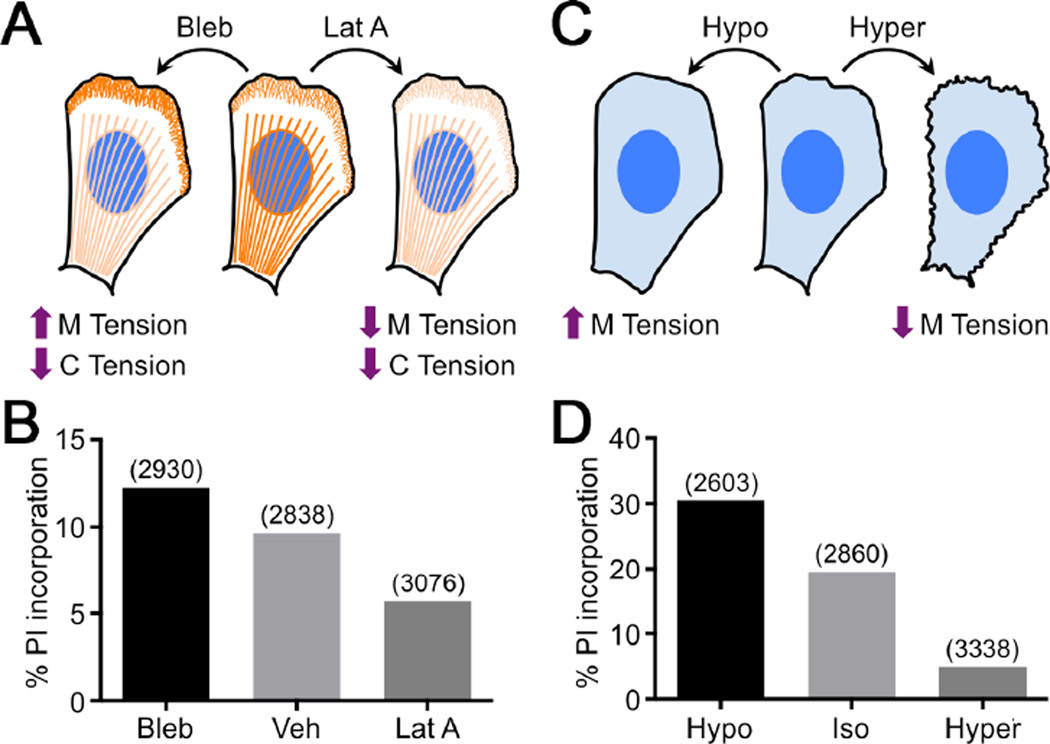
The immunological synapse formed between a cytotoxic T lymphocyte (CTL) and an infected or transformed target cell is a physically active structure capable of exerting mechanical force. Here, we investigated whether synaptic forces promote the destruction of target cells. CTLs kill by secreting toxic proteases and the pore forming protein perforin into the synapse. Biophysical experiments revealed a striking correlation between the magnitude of force exertion across the synapse and the speed of perforin pore formation on the target cell, implying that force potentiates cytotoxicity by enhancing perforin activity. Consistent with this interpretation, we found that increasing target cell tension augmented pore formation by perforin and killing by CTLs. Our data also indicate that CTLs coordinate perforin release and force exertion in space and time. These results reveal an unappreciated physical dimension to lymphocyte function and demonstrate that cells use mechanical forces to control the activity of outgoing chemical signals.


Figures

Figure 1
Figure 1. PTEN and Dock2 are not required for lytic granule polarization and Ca2+ flux
(A–B) OT1 CTLs expressing the indicated shRNAs were mixed with OVA-loaded EL4 cells, fixed, and stained for pericentrin and Lamp1 to visualize the centrosome and lytic granules, respectively. (A) Left, brightfield image of a representative CTL-target cell conjugate. Right, corresponding fluorescence image, with white lines indicating CTL boundaries. (B) Left, polarization index was calculated using the center of gravity (COG) of the lytic granules (see Supplemental Experimental Procedures). Right, quantification of lytic granule polarization index (n ≥ 37 per sample). ns, not significant (two-tailed Student’s T-test). (C) OT1 CTLs expressing the indicated shRNAs were mixed with OVA-loaded EL4 cells and degranulation assessed by surface exposure of Lamp1. (D) CTLs expressing the indicated shRNAs were loaded with Fura2-AM and imaged on glass surfaces coated with H2-Kb-OVA and ICAM1. Left, representative time-lapse montages of CTLs contacting the stimulatory surfaces. Images are pseudocolored with warmer colors (e.g. orange, red) indicating higher concentrations of intracellular Ca2+. Time in MM:SS is indicated above the montages. Right, mean normalized Fura ratio (see Supplemental Experimental Procedures) graphed against time. n ≥ 21 cells per sample. All scale bars = 10 µm. Error bars denote standard error of the mean (SEM). Data are representative of at least two independent experiments. See also Figure S1.
Figure 2
Figure 2. PI3K signaling controls force exertion perpendicular to the IS
(A) Schematic diagram of the micropipette-based system. (B) Time-lapse montage of a representative micropipette experiment. Dashed white line denotes the initial position of the bead. Time is indicated in M:SS in the bottom left corner of each image. (C) Kymograph of the experiment shown in B. The loading rate can be derived from the slope of the red line. (D) Average loading rate during the pulling phase of the response, calculated for cells expressing the indicated shRNAs. Error bars denote SEM. n ≥ 10 cells per condition. *, P < 0.05, **, P < 0.01, calculated by two-tailed Mann-Whitney test. All scale bars = 5 µm. Data are representative of at least two independent experiments. See also Movie S1.
Figure 3
Figure 3. PI3K signaling and NMII control force exertion parallel to the IS
(A) Schematic diagram of the micropillar system. (B–F) CTLs expressing shNT, shDock2, or shPTEN were imaged on stimulatory micropillar arrays. (B) Time-lapse montage of a representative CTL-micropillar interaction. Time is indicated in the top right corner of each image. Large pillar deflections are indicated by yellow arrows. Green asterisks denote “hotspots” of strong force exertion. (C) Average projection of pillar deflections along the line connecting each pillar to the cell center of gravity (COG projection) was determined for the CTL shown in B and plotted against time. (D) Aggregate plot of instantaneous force per pillar exerted by the CTL in B, graphed against time. Pink dots denote pillars in contact with the cell, and blue dots denote pillars outside of the interface. Average force per pillar within the interface is shown in green, and background force per pillar in cyan. (E–F) Total force exertion against the pillar array graphed versus time for CTLs expressing the indicated shRNAs. n ≥ 6 cells per sample. (G) CTLs treated with 50 µM blebbistatin (Bleb) or vehicle control (Veh) were imaged on stimulatory micropillar arrays. Total force exertion against the array is graphed as in E. (H) CTLs expressing the indicated shRNAs were mixed 1:1 with OVA-loaded RMA-s cells. Specific lysis is graphed as a function of OVA concentration. All error bars denote SEM. Data are representative of at least 2 independent experiments. See also Figure S2 and Movie S2.
Figure 4
Figure 4. PTEN deficiency enhances perforin pore formation
(A) Schematic diagram showing perforin pore detection by PI. (B–C) CTLs expressing shNT or shPTEN together with cyan fluorescent protein (CFP) were mixed with carboxyfluorescein succinimidyl ester (CFSE)- labeled, OVA-loaded RMA-s cells and imaged in PDMS microwells in the presence of 100 µM PI. (B) Time-lapse montage of a representative microwell showing conjugate formation (magenta asterisk), and PI influx (purple arrowhead). Time is indicated in H:MM in the bottom left corner of each image. (C) Time between conjugate formation and PI influx (PI influx time) quantified for shNT and shPTEN expressing CTLs. Error bars denote SEM. n ≥ 65 conjugates per sample. P-value calculated by two-tailed Mann-Whitney test. (D) Perforin (Prf) expression in the indicated CTLs was analyzed by Western blot. Actin served as a loading control. (E) prf1+/+ and prf1+/− CTLs expressing the indicated shRNAs were mixed 1:1 with OVA-loaded RMA-s cells. Specific lysis is graphed as a function of OVA concentration. Data are representative of at least 2 independent experiments. See also Movie S3.
Figure 5
Figure 5. Cell tension promotes perforin pore formation and CTL-mediated killing
(A–C) B16 cells were cultured overnight on stiff (E = 50 kPa) or soft (E = 12 kPa) hydrogels, stained with Hoechst 33342, and treated with the indicated dilutions of perforin (1:1000 ≈ 1 µg/ml final concentration) in the presence of 100 µM PI. (A) Schematic diagram of the perforation assay. (B) Representative images before and after perforin treatment on both stiff (top) and soft (bottom) hydrogels. Perforated cells were identified by their PI+ nuclei. (C) Quantification of a representative perforation experiment on hydrogels. Total cell counts are shown in parentheses above each bar. (D) Schematic diagram of a B16 killing assay on hydrogel substrate. (E) OT1 CTLs were added to OVA-loaded B16 cells grown on stiff or soft hydrogels. Specific lysis was quantified by LDH release at the indicated effector to target (E:T) ratios. (F) Schematic diagram of staurosporine-induced apoptosis on hydrogel substrate. (G) B16 cells grown on stiff or soft hydrogels were exposed to the indicated concentrations of staurosporine. Apoptosis was quantified by LDH release. Error bars denote SEM. Data are representative of at least 2 independent experiments. See also Figures S3–S5 and Movies S4 and S5.
Figure 6
Figure 6. Membrane tension potentiates perforin pore formation
(A) Diagram schematizing the effects of blebbistatin (Bleb) and latrunculin A (Lat A) on cortical (C) and membrane (M) tension. Lamellipodial F-actin and stress fibers are indicated in orange. (B) B16 cells cultured on plastic were treated with perforin (1:1000 dilution) in the presence of 100 µM PI and either 100 µM Bleb, 7.5 µM Lat A, or vehicle control (Veh) as indicated. Perforation was quantified by PI incorporation. (C) Diagram schematizing the effects of hypotonic (Hypo) or hypertonic (Hyper) medium on membrane tension. (D) B16 cells cultured on plastic were treated with perforin (1:1000 dilution) in the presence of 100 µM PI either in isotonic (Iso), hypotonic, or hypertonic medium as indicated. Perforation was quantified by PI incorporation. In B and D, total cell counts are shown in parentheses above each bar. Data are representative of 3 independent experiments. See also Figure S4.
Fig. 7
Fig. 7. Degranulation is spatiotemporally correlated with force exertion at the IS
(A) Diagram schematizing fluorescent detection of degranulation during a micropillar experiment. (B–F) CTLs expressing pHluorin-Lamp1 were imaged on stimulatory micropillar arrays. (B) Representative time-lapse montage showing pillar deflections during a degranulation event (indicated by the yellow arrowhead). Time is indicated in M:SS in the top right corner of each image. (C) Graph of the offset time between contact formation and degranulation (degranulation time). (D) Graphical representation of the pillar array in B, with the degranulation position depicted as a green circle and the cell envelope at the moment of degranulation shown in black. Pillars are color-coded based on their average deflection during the degranulation. Warmer colors (e.g. orange, red) denote stronger deflections. The DDP for this degranulation is indicated by the double-headed white arrow. (E) Histogram plot derived from the experiment in B showing the DDP for each position in the CTL interface. The mean value for the distribution is denoted by the vertical cyan line. The vertical green line indicates the DDP for the degranulation itself. (F) DDPs of degranulation (Degran) were compared to the mean values of their paired null distributions. ***, P < 0.001, calculated by two-tailed paired T-test. (G) Schematic diagram of the CTL-array interface showing the radial shells used for spatial analysis. (H–I) The radial distribution of total force exertion (H) and degranulation position (I) in degranulating cells. Color-coding of the bars corresponds to the shells shown in G. Gray bars indicate the spatial distribution that would be expected by chance (outer shells are larger than inner ones). All error bars denote SEM. For C, F, and I, n = 49 degranulation events pooled from three independent experiments. See also Figure S6.

Comment in

References

    1. Babich A, Li S, O'Connor RS, Milone MC, Freedman BD, Burkhardt JK. F-actin polymerization and retrograde flow drive sustained PLCgamma1 signaling during T cell activation. J Cell Biol. 2012;197:775–787. - PMC - PubMed
    1. Bashour KT, Gondarenko A, Chen H, Shen K, Liu X, Huse M, Hone JC, Kam LC. CD28 and CD3 have complementary roles in T-cell traction forces. Proc Natl Acad Sci U S A. 2014;111:2241–2246. - PMC - PubMed
    1. Beal AM, Anikeeva N, Varma R, Cameron TO, Vasiliver-Shamis G, Norris PJ, Dustin ML, Sykulev Y. Kinetics of early T cell receptor signaling regulate the pathway of lytic granule delivery to the secretory domain. Immunity. 2009;31:632–642. - PMC - PubMed
    1. Bertrand F, Muller S, Roh KH, Laurent C, Dupre L, Valitutti S. An initial and rapid step of lytic granule secretion precedes microtubule organizing center polarization at the cytotoxic T lymphocyte/target cell synapse. Proc Natl Acad Sci U S A. 2013;110:6073–6078. - PMC - PubMed
    1. Brown AC, Oddos S, Dobbie IM, Alakoskela JM, Parton RM, Eissmann P, Neil MA, Dunsby C, French PM, Davis I, et al. Remodelling of cortical actin where lytic granules dock at natural killer cell immune synapses revealed by super-resolution microscopy. PLoS Biol. 2011;9:e1001152. - PMC - PubMed

Publication types