

Bayesian Inference for General Gaussian Graphical Models With Application to Multivariate Lattice Data
- PMID: 26924867
- PMCID: PMC4767185
- DOI: 10.1198/jasa.2011.tm10465
Bayesian Inference for General Gaussian Graphical Models With Application to Multivariate Lattice Data
Abstract
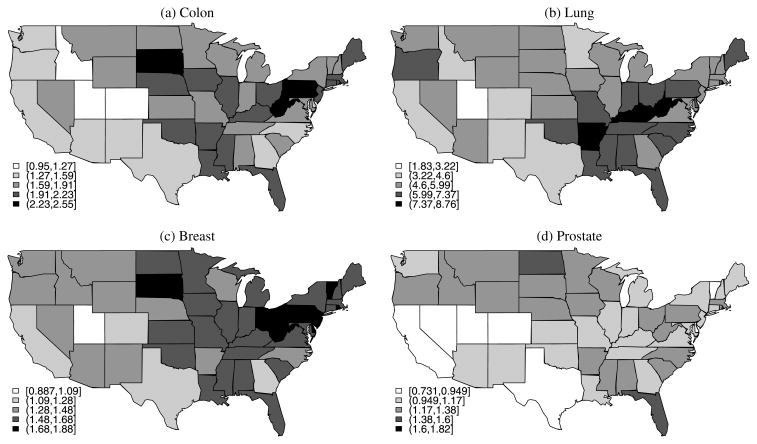
We introduce efficient Markov chain Monte Carlo methods for inference and model determination in multivariate and matrix-variate Gaussian graphical models. Our framework is based on the G-Wishart prior for the precision matrix associated with graphs that can be decomposable or non-decomposable. We extend our sampling algorithms to a novel class of conditionally autoregressive models for sparse estimation in multivariate lattice data, with a special emphasis on the analysis of spatial data. These models embed a great deal of flexibility in estimating both the correlation structure across outcomes and the spatial correlation structure, thereby allowing for adaptive smoothing and spatial autocorrelation parameters. Our methods are illustrated using a simulated example and a real-world application which concerns cancer mortality surveillance. Supplementary materials with computer code and the datasets needed to replicate our numerical results together with additional tables of results are available online.
Keywords: CAR model; G-Wishart distribution; Markov chain Monte Carlo (MCMC) simulation; Spatial statistics.
Figures
References
-
- Armstrong H. PhD thesis. The University of New South Wales; 2005. Bayesian Estimation of Decomposable Gaussian Graphical Models.
-
- Armstrong H, Carter CK, Wong KF, Kohn R. Bayesian Covariance Matrix Estimation Using a Mixture of Decomposable Graphical Models. Statistics and Computing. 2009;19:303–316.
-
- Asci C, Piccioni M. Functionally Compatible Local Characteristics for the Local Specification of Priors in Graphical Models. Scandinavian Journal of Statistics. 2007;34:829–840.
-
- Atay-Kayis A, Massam H. A Monte Carlo Method for Computing the Marginal Likelihood in Nondecomposable Gaussian Graphical Models. Biometrika. 2005;92:317–335.
-
- Banerjee O, El Ghaoui L, D’Aspremont A. Model Selection Through Sparse Maximum Likelihood Estimation for Multivariate Gaussian or Binary Data. Journal of Machine Learning Research. 2008;9:485–516.
Grants and funding
LinkOut - more resources
Full Text Sources