. 2016 Feb 19:7:198.
doi: 10.3389/fpsyg.2016.00198. eCollection 2016.

Reversed Priming Effects May Be Driven by Misperception Rather than Subliminal Processing

Affiliations

Reversed Priming Effects May Be Driven by Misperception Rather than Subliminal Processing

Anders Sand. Front Psychol. .

Abstract

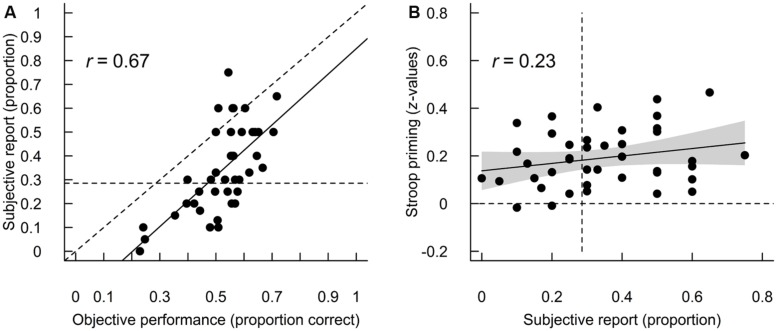
A new paradigm for investigating whether a cognitive process is independent of perception was recently suggested. In the paradigm, primes are shown at an intermediate signal strength that leads to trial-to-trial and inter-individual variability in prime perception. Here, I used this paradigm and an objective measure of perception to assess the influence of prime identification responses on Stroop priming. I found that sensory states producing correct and incorrect prime identification responses were also associated with qualitatively different priming effects. Incorrect prime identification responses were associated with reversed priming effects but in contrast to previous studies, I interpret this to result from the (mis-)perception of primes rather than from a subliminal process. Furthermore, the intermediate signal strength also produced inter-individual variability in prime perception that strongly influenced priming effects: only participants who on average perceived the primes were Stroop primed. I discuss how this new paradigm, with a wide range of d' values, is more appropriate when regression analysis on inter-individual identification performance is used to investigate perception-dependent processing. The results of this study, in line with previous results, suggest that drawing conclusions about subliminal processes based on data averaged over individuals may be unwarranted.

Keywords: perception; signal detection theory; stimulus strength; subliminal priming; trial-based analysis; unconscious processing.


Figures

FIGURE 1
FIGURE 1
Proportion of prime responses for each of the four prime words. The prime word is shown on the x-axis and prime responses are illustrated as the color of the boxplots (in the same order). Mean and 95% confidence intervals are superimposed.
FIGURE 2
FIGURE 2
(A) Correlation between participants’ objective prime identification performance across all ISIs and self-reported proportion of perceived primes. Proportion correct rather than d′ is shown here for comparison with self-reports. The straight line shows the fitted regression slope. For reference, the diagonal is shown as a dotted line and the proportion of primes is shown with an ISI of 100 ms as the horizontal dotted line. (B) Relationship between participants’ self-reported proportion of perceived primes and Stroop priming (as z-values) across all ISIs. The straight line shows the fitted linear regression slope and the gray polygon is its 95% confidence interval. For reference, the vertical dotted line is the proportion of primes shown with an ISI of 100 ms and the horizontal dotted line is zero priming.
FIGURE 3
FIGURE 3
Relationship between d′ and Stroop priming (as z-values) for the 12.5-ms (A) and 25-ms ISIs (B). In both figures, the straight line shows the fitted linear regression slope and the gray polygon is its 95% confidence interval. Note the difference in x-axis between the two figures. For reference, the vertical dotted lines show chance performance and the 95% performance levels based on the binomial distribution.
FIGURE 4
FIGURE 4
Relationship between d′ and Stroop priming (as z-values) for correct (A,B) and incorrect (C,D) prime identification responses for the 12.5-ms (A,C) and 25-ms ISIs (B,D). In the upper panels, priming is calculated as correct incongruent – correct congruent, and in the lower panels as incorrect incongruent – incorrect congruent. In all panels, the straight line shows the fitted linear regression slope and the gray polygon is its 95% confidence interval. Note the difference in x-axis between the left and right panels. For reference, the vertical dotted lines show chance performance and the 95% performance levels based on the binomial distribution.

References

    1. Albrecht T., Mattler U. (2012). Individual differences in subjective experience and objective performance in metacontrast masking. J. Vis. 12 5–5. 10.1167/12.5.5 - DOI - PubMed
    1. Björkman M., Juslin P., Winman A. (1993). Realism of confidence in sensory discrimination: the underconfidence phenomenon. Percept. Psychophys. 54 75–81. 10.3758/BF03206939 - DOI - PubMed
    1. Cheesman J., Merikle P. M. (1984). Priming with and without awareness. Percept. Psychophys. 36 387–395. 10.3758/BF03202793 - DOI - PubMed
    1. Cleeremans A. (2011). The radical plasticity thesis: how the brain learns to be conscious. Front. Psychol. 2:86 10.3389/fpsyg.2011.00086 - DOI - PMC - PubMed
    1. Costello P., Jiang Y., Baartman B., McGlennen K., He S. (2009). Semantic and subword priming during binocular suppression. Conscious. Cogn. 18 375–382. 10.1016/j.concog.2009.02.003 - DOI - PMC - PubMed

LinkOut - more resources