. 2016 Feb 19:7:187.
doi: 10.3389/fmicb.2016.00187. eCollection 2016.

Bacteria within the Gastrointestinal Tract Microbiota Correlated with Improved Growth and Feed Conversion: Challenges Presented for the Identification of Performance Enhancing Probiotic Bacteria

Affiliations

Bacteria within the Gastrointestinal Tract Microbiota Correlated with Improved Growth and Feed Conversion: Challenges Presented for the Identification of Performance Enhancing Probiotic Bacteria

Dragana Stanley et al. Front Microbiol. .

Abstract

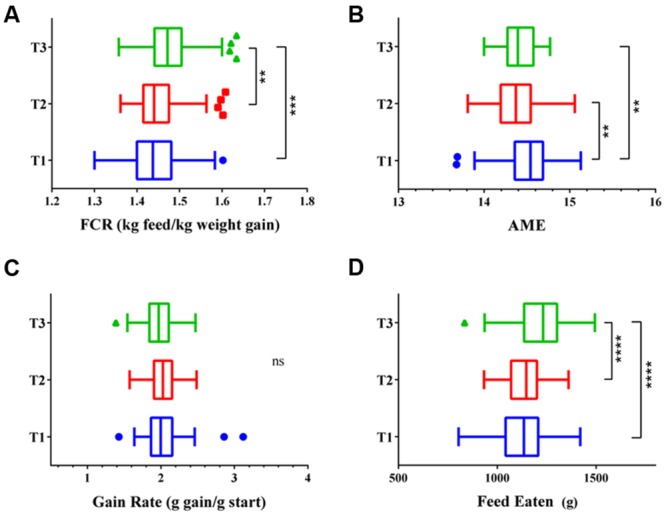
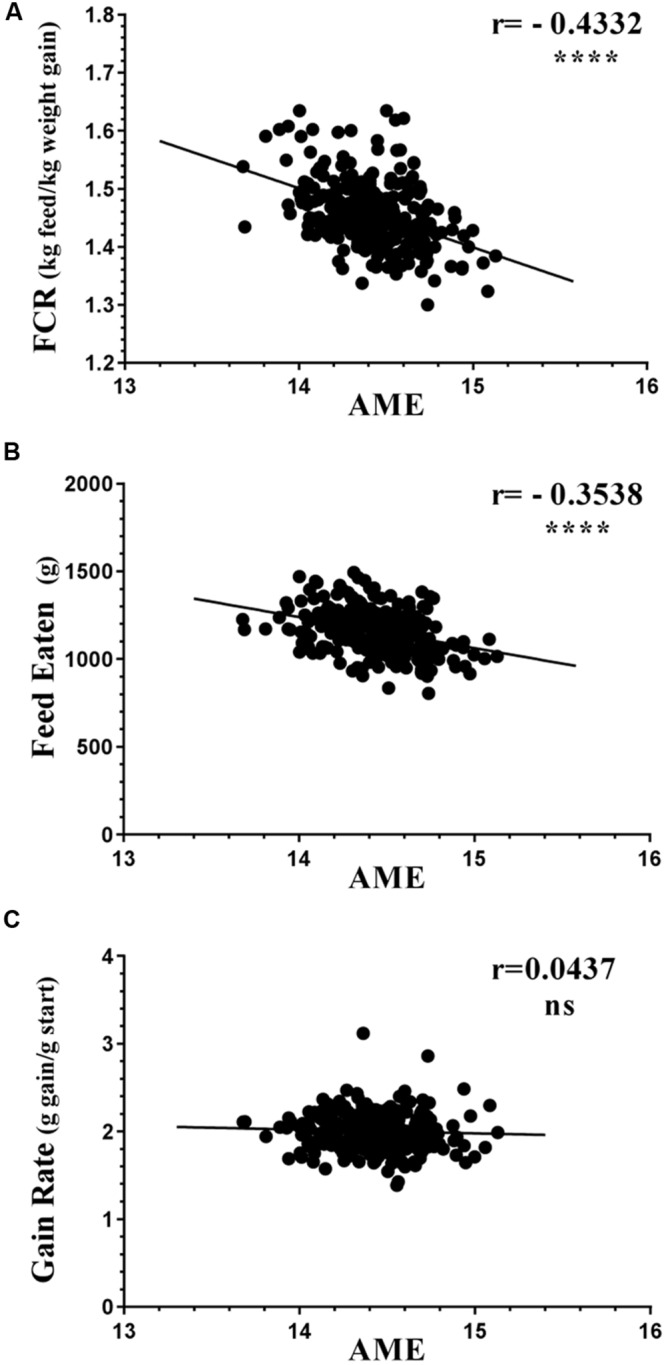
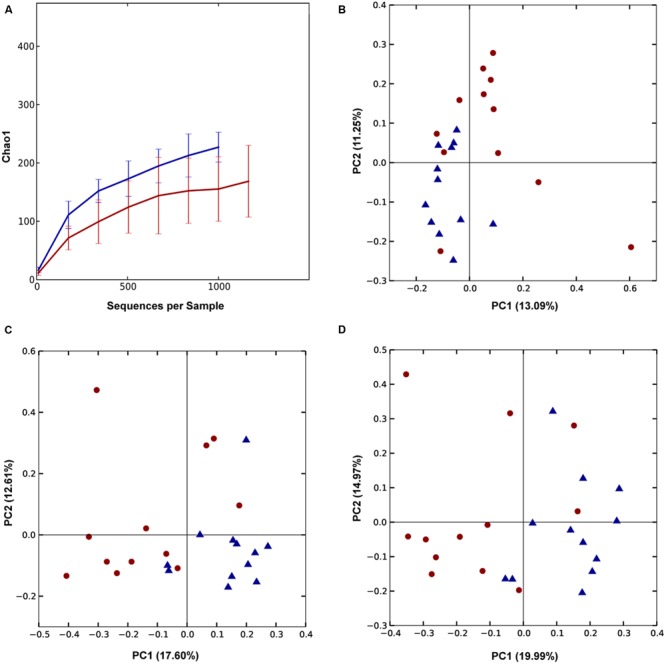
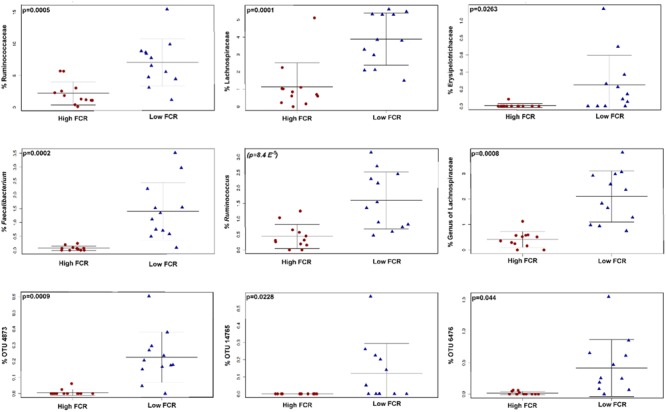
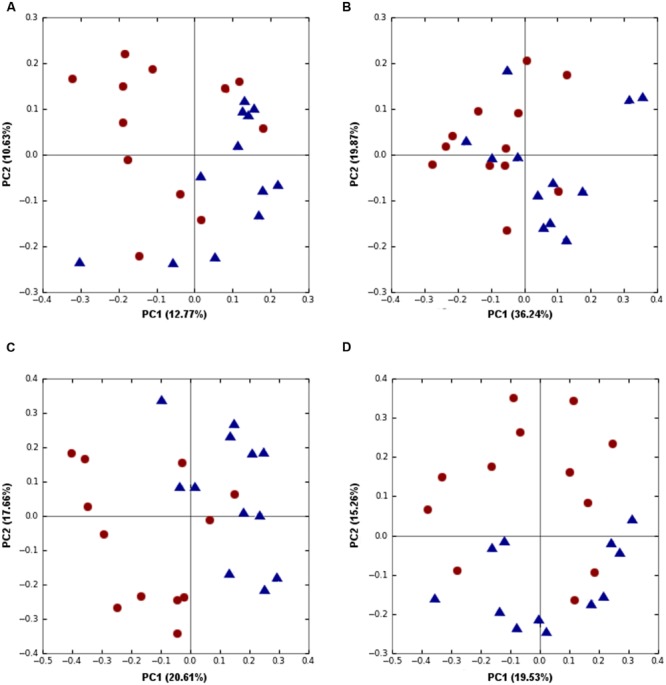
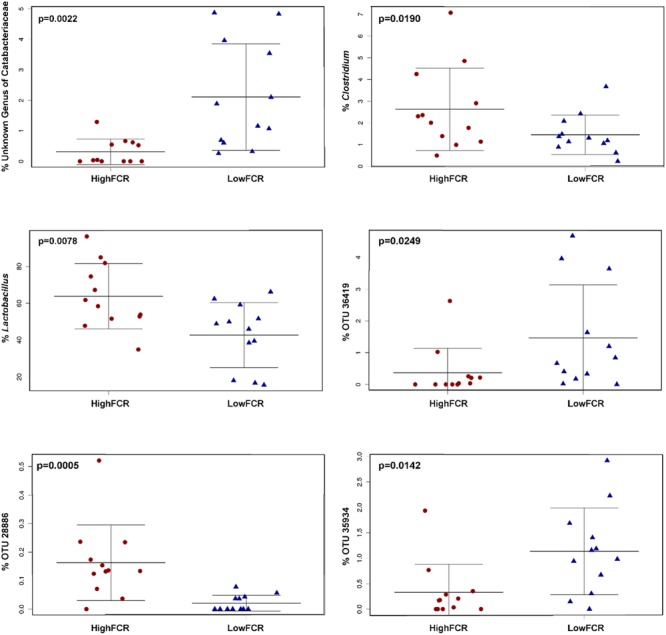
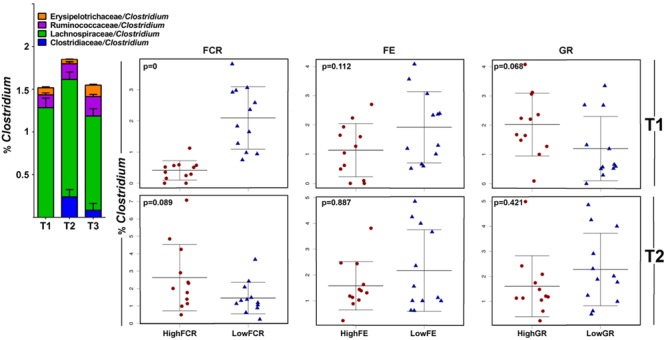
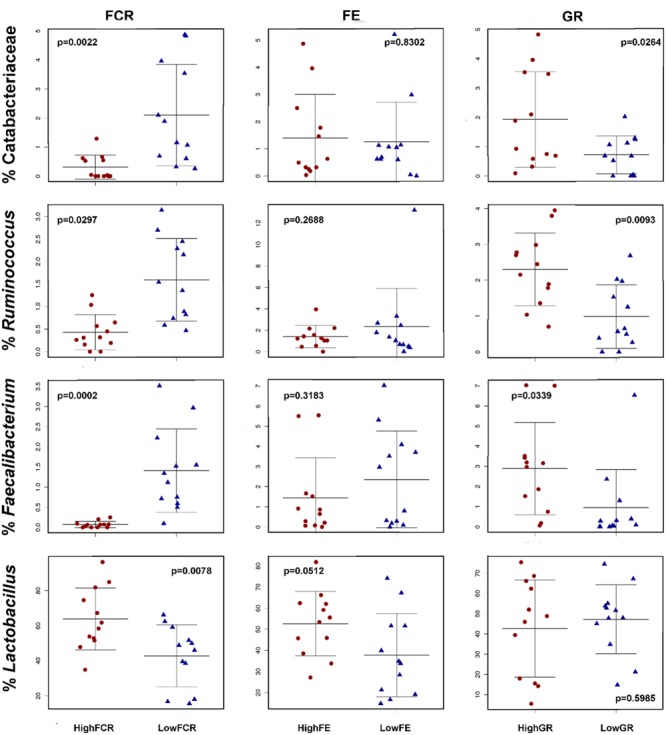
Identification of bacteria associated with desirable productivity outcomes in animals may offer a direct approach to the identification of probiotic bacteria for use in animal production. We performed three controlled chicken trials (n = 96) to investigate caecal microbiota differences between the best and poorest performing birds using four performance measures; feed conversion ratio (FCR), utilization of energy from the feed measured as apparent metabolisable energy, gain rate (GR), and amount of feed eaten (FE). The shifts in microbiota composition associated with the performance measures were very different between the three trials. Analysis of the caecal microbiota revealed that the high and low FCR birds had significant differences in the abundance of some bacteria as demonstrated by shifts in microbiota alpha and beta diversity. Trials 1 and 2 showed significant overall community shifts, however, the microbial changes driving the difference between good and poor performers were very different. Lachnospiraceae, Ruminococcaceae, and Erysipelotrichaceae families and genera Ruminococcus, Faecalibacterium and multiple lineages of genus Clostridium (from families Lachnospiraceae, Ruminococcaceae, and Erysipelotrichaceae) were highly abundant in good FCR birds in Trial 1. Different microbiota was associated with FCR in Trial 2; Catabacteriaceae and unknown Clostridiales family members were increased in good FCR and genera Clostridium (from family Clostridiaceae) and Lactobacillus were associated with poor FCR. Trial 3 had only mild microbiota differences associated with all four performance measures. Overall, the genus Lactobacillus was correlated with feed intake which resulted in poor FCR performance. The genus Faecalibacterium correlated with improved FCR, increased GR and reduced FE. There was overlap in phylotypes correlated with improved FCR and GR, while different microbial cohorts appeared to be correlated with FE. Even under controlled conditions different cohorts of birds developed distinctly different microbiotas. Within the different trial groups the abundance of certain bacterial groups correlated with productivity outcomes. However, with different underlying microbiotas there were different bacteria correlated with performance. The challenge will be to identify probiotic bacteria that can reliably deliver favorable outcomes from diverse microbiotas.

Keywords: caecum; digestive efficiency; energy assimilation; feed conversion; gastrointestinal tract; microbiota; probiotic; weight gain.


Figures

FIGURE 1
FIGURE 1
Performance of the three flocks shown as (A) feed conversion ratio (FCR), (B) apparent metabolisable energy (AME), (C) gain rate (GR), and (D) feed eaten (FE). Trial 1 is shown in blue, Trial 2 in red, and Trial 3 in green. p < 0.01, ∗∗p < 0.005, ∗∗∗p < 0.001
FIGURE 2
FIGURE 2
Correlations of AME against (A) FCR, (B) FE, and (C) GR. All birds from all three trials are represented as circles. The birds with higher AME values corresponding to better efficiency in energy extraction are likely to have lower (better) FCR, mostly due to eating less feed while having no change in gain rate (GR). Supplementary Figure S1 shows the same variables separately in each trial; demonstrating that this trend is reproducible.
FIGURE 3
FIGURE 3
Trial 1: Differences between high (red) and low (blue) FCR microbial communities. (A) Alpha diversity metric Chao1 was significantly (p = 0.0021) higher in low FCR birds. (B) Unweighted UniFrac (p = 3E-4) PCoA plot; (C,D) PCoA plot of beta diversity using Canberra distance at a genus (C) and family level (D). Communities of high and low FCR birds were significantly different based on Canberra distance at a genus (p = 7E-5) or family level (p = 3.9E-4).
FIGURE 4
FIGURE 4
The taxa responsible for differences in high and low FCR cecal communities in Trial 1. The figure shows family (top row), genus (middle row) and OTU level (bottom row). A table with all differentially abundant phylotypes is given in Supplementary Table S1. The closest cultured strain (EzTaxon database) to OTU 4873 was F. praustnizii [ATCC 27768(T)] with 93.7% pairwise similarity, OTU 14765 was closest to Clostridium spiroforme [DSM 1552(T)] with 99.6% pairwise similarity to the type strain and out 6476 was closest to C. lactatifermentans (89.76%).
FIGURE 5
FIGURE 5
Trial 2 beta diversity was significantly different between high (red) and low (blue) FCR birds microbial communities. (A) Unweighted (p = 0.0019) and (B) Weighted Unifrac (p = 0.0072) at an OTU level as well as Canberra beta diversity at a (C) genus (p = 0.0055) and (D) family (p = 1.8E-4) levels were separating high and low FCR birds.
FIGURE 6
FIGURE 6
Some of the significantly (FCR) differential genera and OTUs in Trial 2. Genus Clostridium significantly correlated with poor performing (high FCR) birds is of the lineage Clostridiaceae/Clostridium. The closest cultured strain to OTU36419 was Ruminococcus albus (similarity 90.06%), to OTU28886 Lactobacillus reuteri (98.98%) and to OTU35934 C. cellobioparum (83.13%).
FIGURE 7
FIGURE 7
Different members of the genus Clostridium correlate with growth performance in different trials. In this analysis all genera listed as Clostridium were merged and the correlation of total Clostridium abundance is shown in stripcharts for Trial 1 (top row) and Trial 2 (bottom row); there were no differences in Trial 3. Clostridium species had lineages split between families Clostridiaceae, Ruminococcaceae, Lachnospiraceae, and Eryspelotrichaceae. The trial 1 Clostridium community, with no members of the Clostridiaceae/Clostridium lineage (blue on the barchart above), correlated with improved FCR and slightly reduction in FE and increased GR. In Trial 2 (and more so in Trial 3), the Clostridiaceae lineage of Clostridium gave non-significant differences in the opposite FCR direction.
FIGURE 8
FIGURE 8
Feed conversion ratio associated OTUs have variable correlations with FE and GR performance. Bacteria correlated in abundance with good (low) FCR levels were generally also correlated with good (high) GR levels but showed no significant correlation with either high or low FE. (Top row) the family Catabacteriaceae from Trial 2. (Second row) Ruminococcus from Trial 1. (Third row) Faecalibacterium from Trial 1. (Fourth row) in Trial 2 the Lactobacillus genera was associated with poor FCR performance but showed no significant correlation with either FE or GR levels.

References

    1. Ajuwon K. M. (2015). Toward a better understanding of mechanisms of probiotics and prebiotics in poultry. J. Appl. Poult. Res. 14:2015 10.3382/japr/pfv074 - DOI
    1. Ashelford K. E., Chuzhanova N. A., Fry J. C., Jones A. J., Weightman A. J. (2005). At least 1 in 20 16S rRNA sequence records currently held in public repositories is estimated to contain substantial anomalies. Appl. Environ. Microbiol. 71 7724–7736. 10.1128/AEM.71.12.7724-7736.2005 - DOI - PMC - PubMed
    1. Biddle A., Stewart L., Blanchard J., Leschine S. (2013). Untangling the genetic basis of fibrolytic specialization by lachnospiraceae and ruminococcaceae in diverse gut communities. Diversity 5 627–640. 10.3390/d5030627 - DOI
    1. Bragg L., Stone G., Imelfort M., Hugenholtz P., Tyson G. W. (2012). Fast, accurate error-correction of amplicon pyrosequences using Acacia. Nat. Methods 9 425–426. 10.1038/nmeth.1990 - DOI - PubMed
    1. Caporaso J. G., Kuczynski J., Stombaugh J., Bittinger K., Bushman F. D., Costello E. K., et al. (2010). QIIME allows analysis of high-throughput community sequencing data. Nat. Methods 7 335–336. 10.1038/nmeth.f.303 - DOI - PMC - PubMed

LinkOut - more resources