. 2016 Feb 18:7:149.
doi: 10.3389/fpls.2016.00149. eCollection 2016.

Box-Counting Dimension Revisited: Presenting an Efficient Method of Minimizing Quantization Error and an Assessment of the Self-Similarity of Structural Root Systems

Affiliations

Box-Counting Dimension Revisited: Presenting an Efficient Method of Minimizing Quantization Error and an Assessment of the Self-Similarity of Structural Root Systems

Martin Bouda et al. Front Plant Sci. .

Abstract

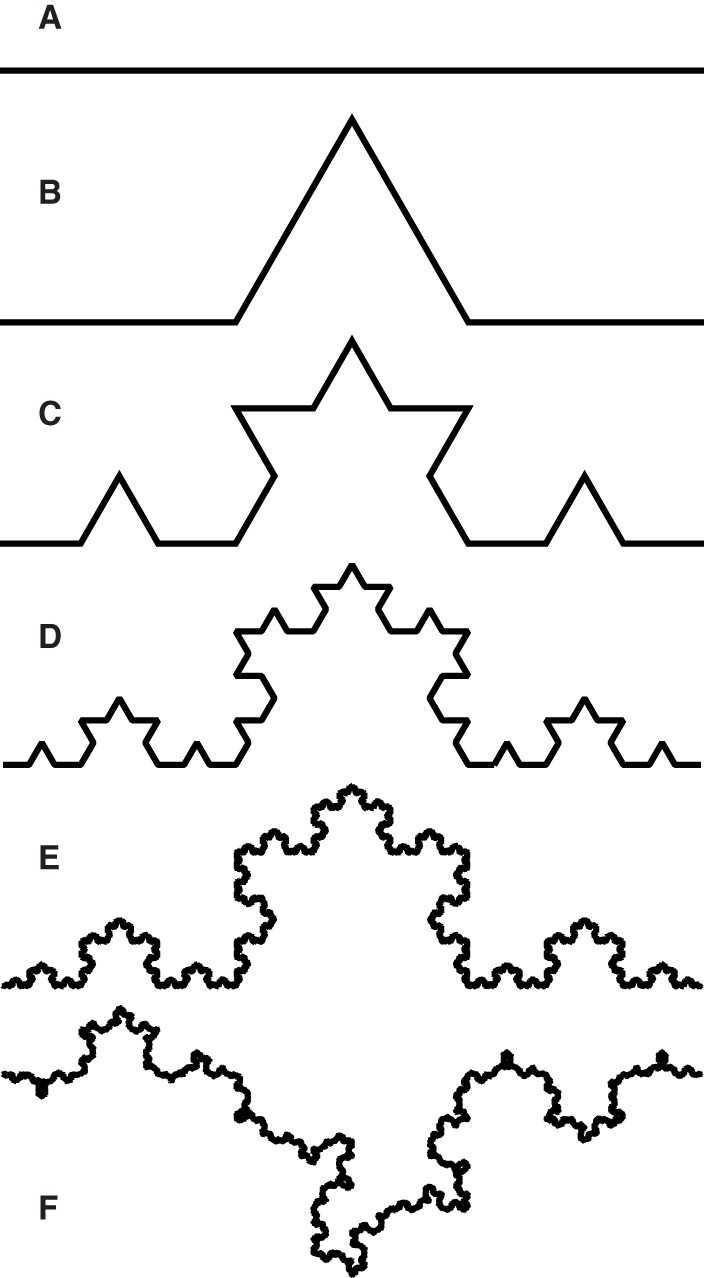
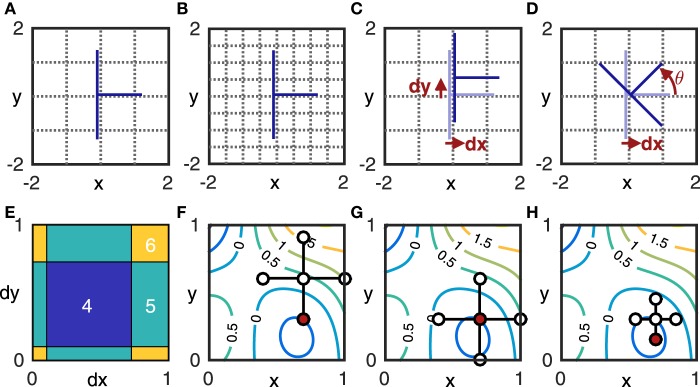
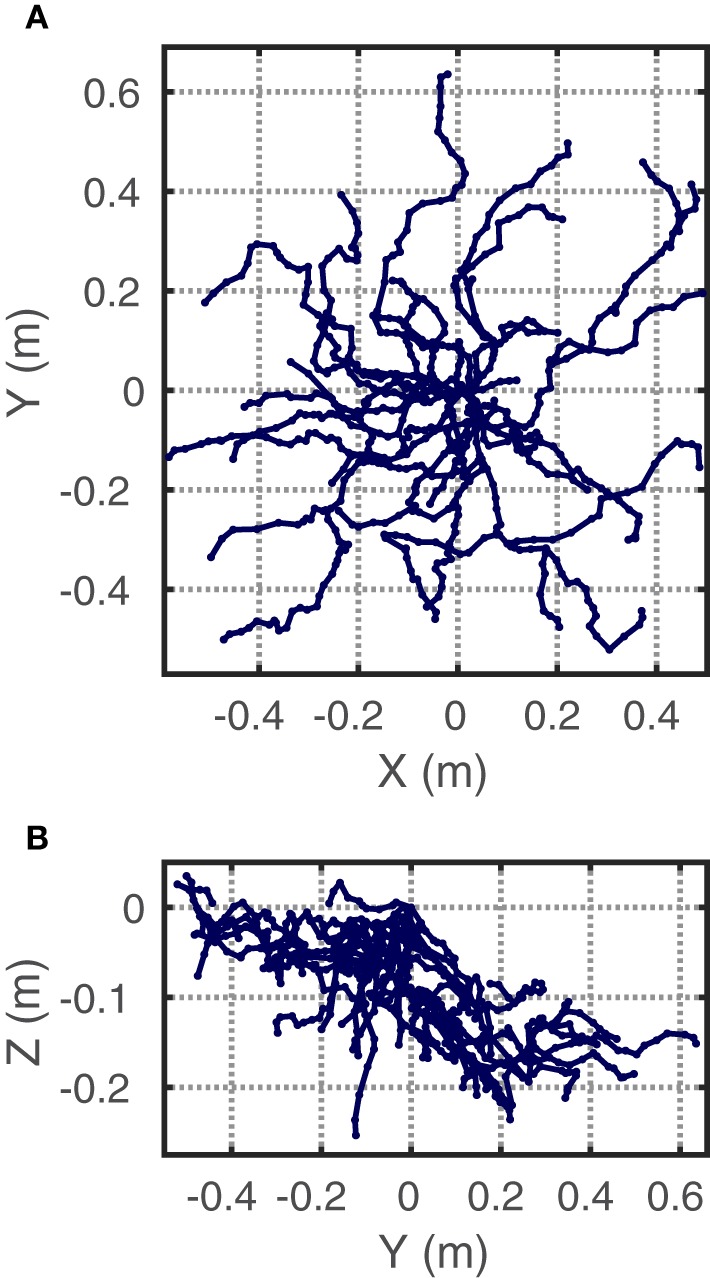
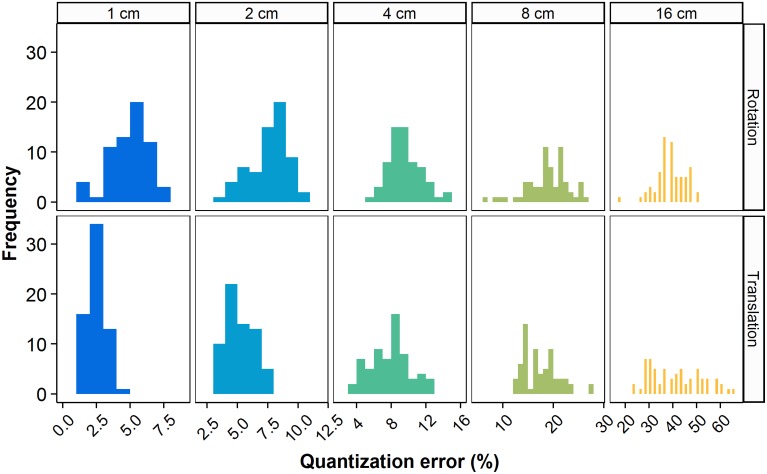
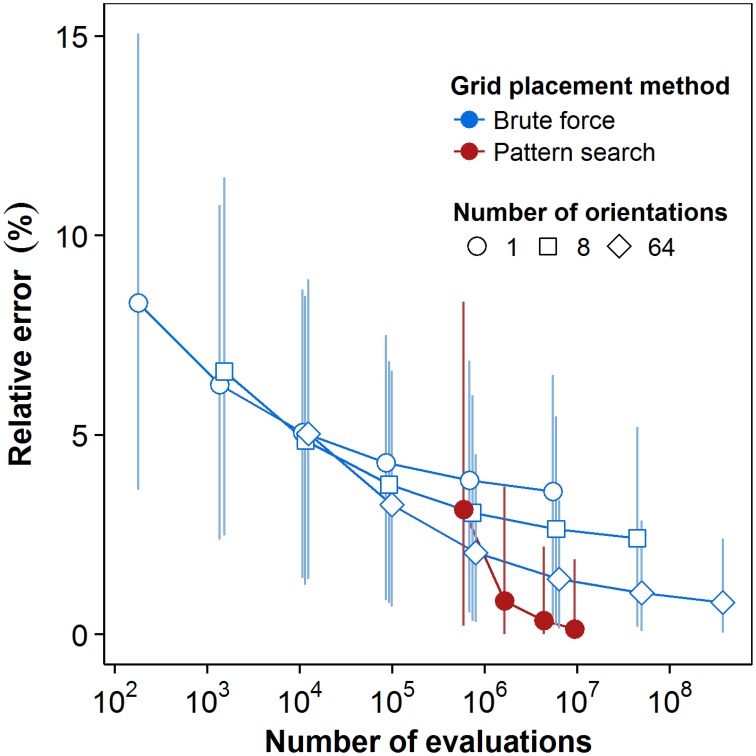
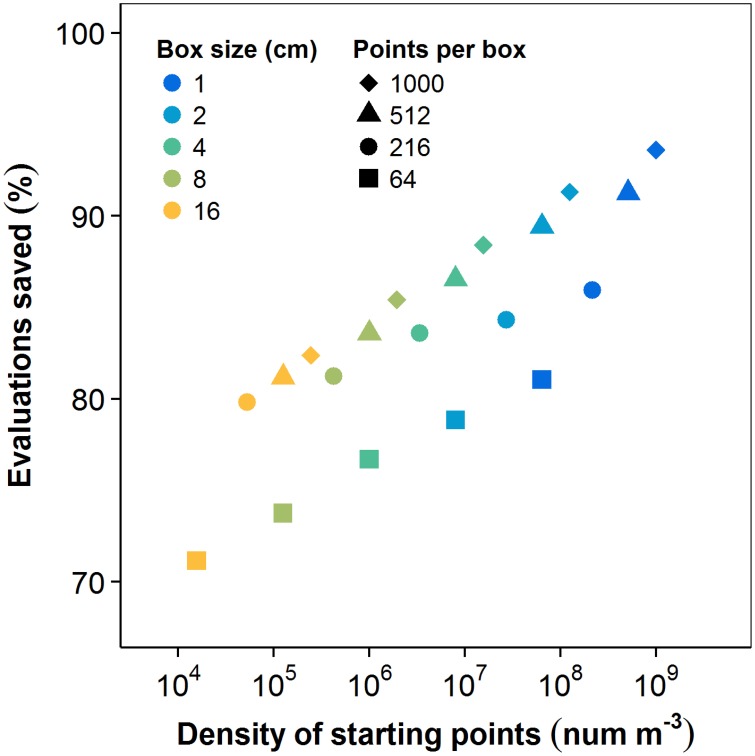
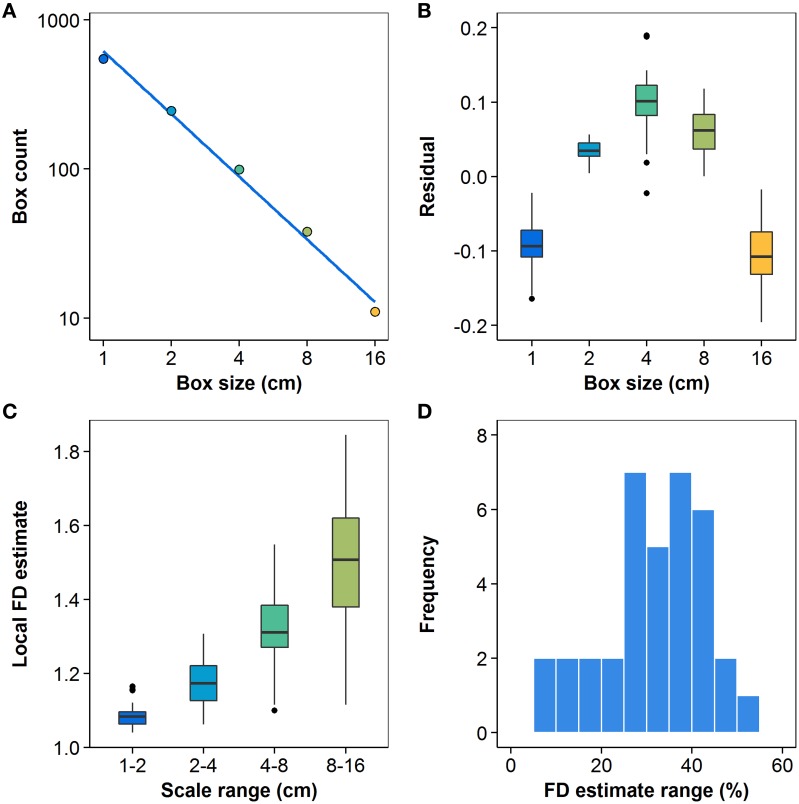
Fractal dimension (FD), estimated by box-counting, is a metric used to characterize plant anatomical complexity or space-filling characteristic for a variety of purposes. The vast majority of published studies fail to evaluate the assumption of statistical self-similarity, which underpins the validity of the procedure. The box-counting procedure is also subject to error arising from arbitrary grid placement, known as quantization error (QE), which is strictly positive and varies as a function of scale, making it problematic for the procedure's slope estimation step. Previous studies either ignore QE or employ inefficient brute-force grid translations to reduce it. The goals of this study were to characterize the effect of QE due to translation and rotation on FD estimates, to provide an efficient method of reducing QE, and to evaluate the assumption of statistical self-similarity of coarse root datasets typical of those used in recent trait studies. Coarse root systems of 36 shrubs were digitized in 3D and subjected to box-counts. A pattern search algorithm was used to minimize QE by optimizing grid placement and its efficiency was compared to the brute force method. The degree of statistical self-similarity was evaluated using linear regression residuals and local slope estimates. QE, due to both grid position and orientation, was a significant source of error in FD estimates, but pattern search provided an efficient means of minimizing it. Pattern search had higher initial computational cost but converged on lower error values more efficiently than the commonly employed brute force method. Our representations of coarse root system digitizations did not exhibit details over a sufficient range of scales to be considered statistically self-similar and informatively approximated as fractals, suggesting a lack of sufficient ramification of the coarse root systems for reiteration to be thought of as a dominant force in their development. FD estimates did not characterize the scaling of our digitizations well: the scaling exponent was a function of scale. Our findings serve as a caution against applying FD under the assumption of statistical self-similarity without rigorously evaluating it first.

Keywords: code:MATLAB; fractal dimension; numerical optimization; plant root growth; root architecture; self-similarity.


Figures

Figure 1
Figure 1
Construction of the Koch curve, following Falconer (2003). Each interval (A) is divided evenly into three and the middle section is replaced by the complementary two sides of an equilateral triangle (B). The process is repeated for each newly created interval, yielding the second (C), third (D), and nth iterations. The Koch curve is the limit approached as n → ∞. The limit curve can be subdivided into four quarters, each an exact copy of the whole, scaled down by a factor of three. The curve is thus self-similar with a similarity dimension of log(4)/log(3). Even with n = 10 (E), zooming in on the pinnacle of the curve by a factor of three yields an image visually indistinguishable from the largest magnification five times over, meaning the curve is approximately self-similar over a finite range of scales. Following the same construction, but randomly choosing the side of the old interval on which each new pair of intervals is placed, yields one of many “statistically self-similar” curves (F). These cannot be divided into sets of identical copies; rather, their parts are scaled random variations on the whole and they only conform to a fractal dimension on average.
Figure 2
Figure 2
Components of numerical methods used in this study. (A,B) show box-counting in 2D on an idealized skeletonized root in blue: at box size s = 1 the root intersects N (s) = 6 boxes (A), at s = 1∕2, N (s) = 9 (B). (C,D) show the effect of placement on the box-count with s = 1: translation by dx and dy yields N = 4; translation by dx and rotation by θ yields N = 3. Taking N = 3 as the minimum value, the box-count estimates Nϵ in (A,C) include quantization error ϵA = 3 and ϵC = 1, respectively. (E) shows the box-count Nϵ as a function J (dx, dy) at θ = 0. It generalizes (C) to show the box-count values for all combinations of 0 < dx < 1 and 0 < dy < 1. Note that the function jumps by integer values and is thus not continuously differentiable, but exhibits the following symmetry: J (dx + a, dy, θ) = J (dx, dy + a, θ) = J (dx, dy, θ) for any integer a, since a translation of the grid in any direction by the grid-size s yields the same grid. The same symmetry is obtained for rotation by multiples of π ∕ 2. (F–H) illustrate pattern search on the contour plot of an unknown function Z = f (x, y). Given a starting point (x0, y0) to serve as the center for a five-point stencil and a step-size Δv, the function is evaluated in step one (F) at the center and four outlying points (x0 ± Δv, y0 ± Δv). The lowest value of Z (indicated in red) is found at (x0, y0 − Δv), which thus becomes the stencil center for the next step. In step two (G), the function is again evaluated at each of the five points of the new stencil. The minimum value (red) is found at the center this time, so the stencil is not moved for the next step, but the step-size is reduced to Δv∕2. In step three (H) the function is evaluated at the five points of the new stencil and a new minimum is identified. This process continues until the step-size reaches a chosen lower bound.
Figure 3
Figure 3
Example of the coarse root system representations used for box-counting. The data are piecewise linear interpolants constructed from the positional and topological data of a MTG of a Berberis thunbergii plant in (A) top- and (B) side-view. Grid origin set at root collar.
Figure 4
Figure 4
Relative quantization error for the representative Berberis thunbergii plant shown in Figure 3. Box-counts from the first 64 rotations (top) and the first 64 translations (bottom) are shown independently at each box size.
Figure 5
Figure 5
Convergence plot for the brute force and pattern search methods. Computational cost is quantified as the number of box-counts executed. Box-counts were pooled over all grid sizes and over all plants to reflect the total cost for the dataset. Error estimates reflect the lowest box-counts achievable for a given number of orientations and translations. Point markers represent the mean estimated relative error levels over all (n = 36) plants. Error bars indicate 95% confidence intervals, see text for details.
Figure 6
Figure 6
Box-count evaluations eliminated by including the history function, as a function of the starting point density (nptss3). The density of starting points, and thus the time savings due to elimination of redundancy, increase separately with increasing number of starting points and decreasing box size.
Figure 7
Figure 7
(A) Log-space linear regression (R2 > 0.99) to box-count data for the representative Berberis thunbergii plant shown in Figure 3; (B) distributions of residuals for all n = 36 plants at each box size; (C) local values of slope Vi from Equation (4); (D) distribution of differences between maximum and minimum local slope estimates, relative to a plant's mean FD estimate (n = 36). All box plots show the median, 25th and 75th percentiles, whiskers extending to 1.5 times the inter-quartile range, and outliers.

References

    1. Aagaard K., Hartvigsen G. (2014). Assessing spatial patterns of plant communities at varying stages of succession. Appl. Math. 5, 1842–1851. 10.4236/am.2014.512177 - DOI
    1. Audet C., Dennis J. (2003). Analysis of generalized pattern searches. SIAM J. Optim. 13, 889–903. 10.1137/S1052623400378742 - DOI
    1. Bari A., Ayad G., Martin A., Gonzalez-Andujar J., Nachit M., Elouafi I. (2004). Fractals and plant water use efficiency, in Thinking in Patterns: Fractals and Related Phenomena in Nature, 8th International Conference on Thinking in Patterns -Fractals and Related Phenomena in Nature, ed Novak M. (Vancouver, BC: ), 315–316. 10.1142/9789812702746-0029 - DOI
    1. Barthélémy D., Caraglio Y. (2007). Plant architecture: a dynamic, multilevel and comprehensive approach to plant form, structure and ontogeny. Ann. Bot. 99, 375–407. 10.1093/aob/mcl260 - DOI - PMC - PubMed
    1. Barto E. K., Cipollini D. (2009). Garlic mustard (alliaria petiolata) removal method affects native establishment. Invas. Plant Sci. Manag. 2, 230–236. 10.1614/IPSM-09-011.1 - DOI

LinkOut - more resources