. 2016 Feb 1;7(2):989-994.
doi: 10.1039/C5SC03417E. Epub 2015 Nov 10.

Activating Peptides for Cellular Uptake via Polymerization into High Density Brushes

Affiliations

Activating Peptides for Cellular Uptake via Polymerization into High Density Brushes

Angela P Blum et al. Chem Sci. .

Abstract

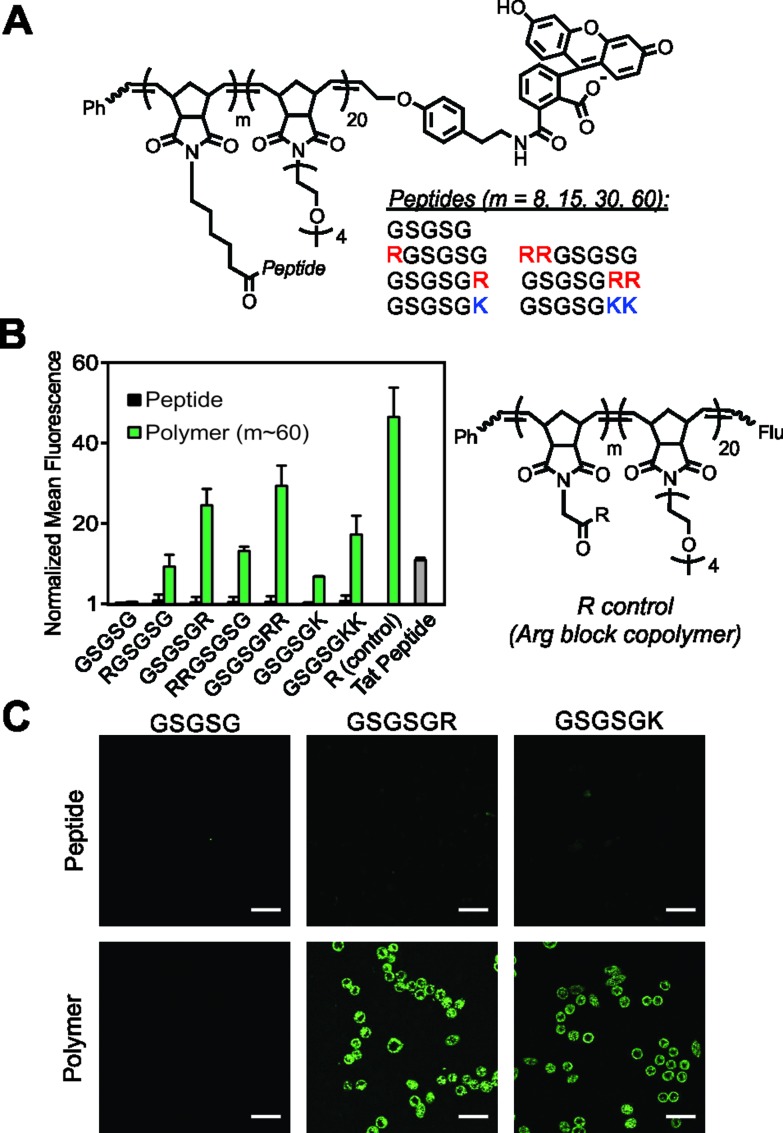
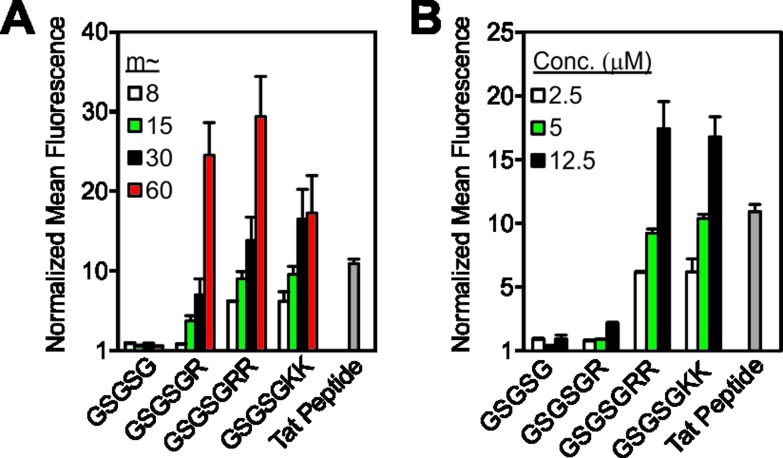
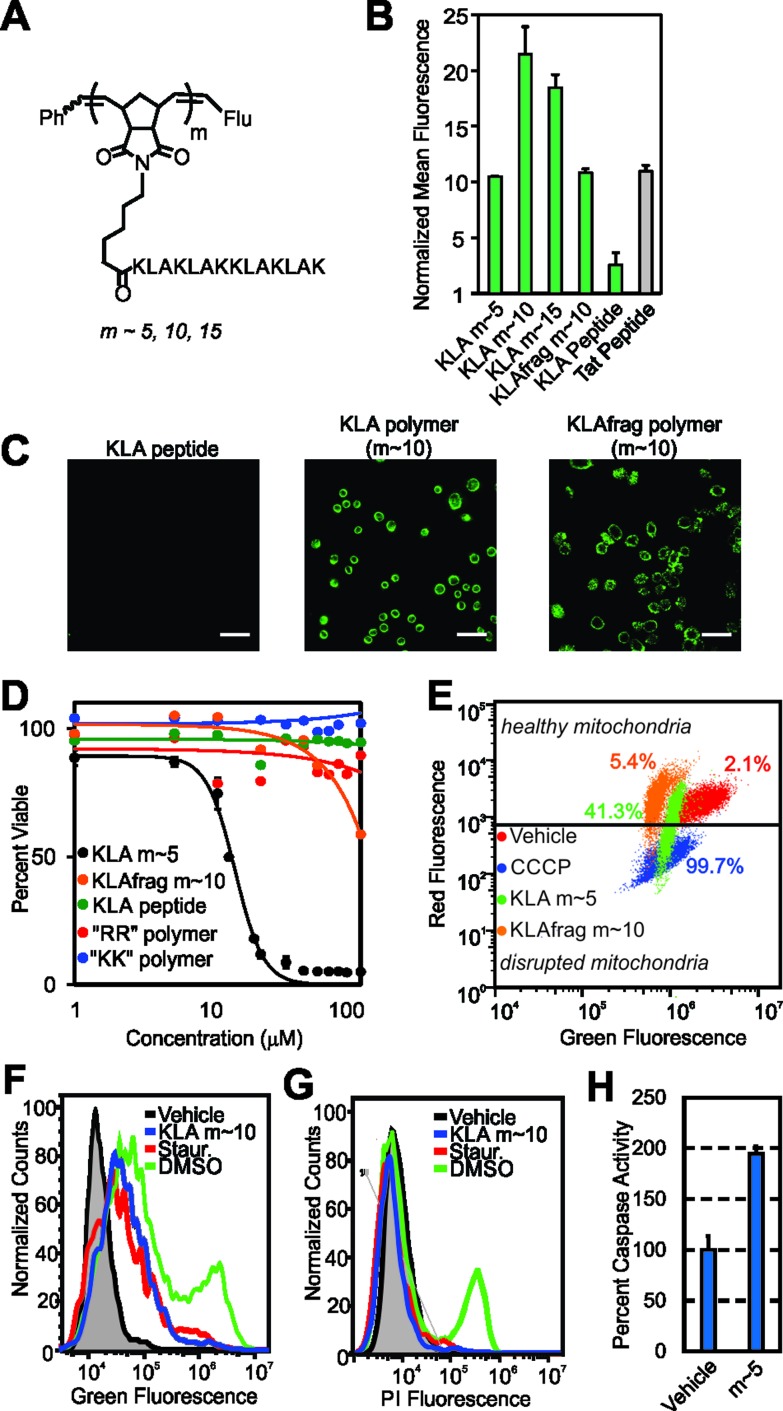
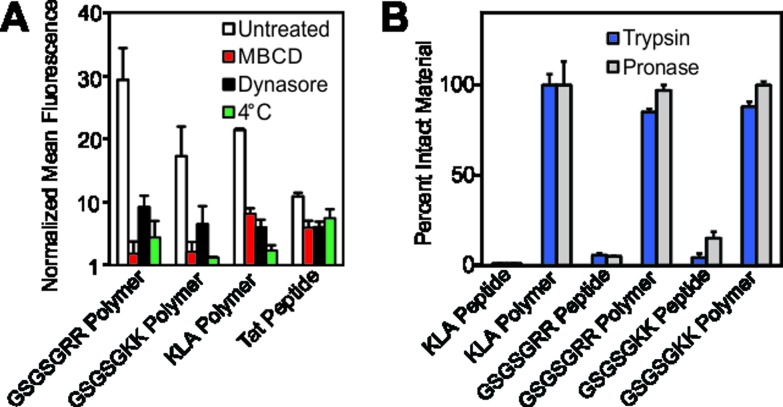
The utility of peptide therapeutics is thwarted by an inability to enter cells, preventing access to crucial intracellular targets. Herein, we describe a simple and potentially widely applicable solution involving the polymerization of a minimally modified amino acid sequence into a high density brush polymer. Specifically, non-cell penetrating peptides can be rendered competent for cell entry by first including a single Arg or Lys in their amino acid sequence, if one is not already present, along with a norbornenyl unit. This modified monomer is then polymerized by ring opening metathesis polymerization (ROMP). To demonstrate the utility of this strategy, a known therapeutic peptide, which does not penetrate cells on its own, was polymerized. The resulting polymer proficiently entered cells while maintaining its intracellular function. We anticipate that this methodology will find broad use in medicine, increasing or enabling the in vivo efficacy of promising peptide therapeutics.


Figures

Fig. 1
Fig. 1. Cellular internalization of GSGSG polymers and analogues. (A) Chemical structure of peptide block copolymers. (B) Flow cytometry data showing fluorescent signatures of HeLa cells treated with the polymers (m ∼ 60) and their monomeric counterparts. All data are normalized to the vehicle (DPBS), which is assigned a value of 1. The R control is a block copolymer that contains a single Arg attached via a short linker to each polymer side chain of this first polymer block (m ∼ 60). “Flu” is the fluorescein end-label shown in A. (C) Live-cell confocal microscopy images showing the average intensities from six consecutive 1 μm slices of HeLa cells treated with peptides and polymers (m ∼ 60). Scale bars are 50 μm. In each study, the concentration of material is 2.5 μM with respect to fluorophore.
Fig. 2
Fig. 2. Strategies for increasing cellular uptake of GSGSG analogues. Flow cytometry data exploring the impact of (A) degree of polymerization, where each polymer is at a concentration of 2.5 μM and (B) the concentration of m ∼ 8 polymers. All data are normalized to DPBS at a value of 1 and concentration is with respect to fluorophore content. Data for additional polymers are shown in Fig. S10–S11.
Fig. 3
Fig. 3. Cellular internalization and bioactivity of KLA peptide homopolymers. (A) Chemical structure of the homopolymers. “Flu” is the fluorescein end-label shown in Fig. 1A. (B) Flow cytometry data showing fluorescent signatures of HeLa cells treated with the KLA polymers and peptide. Data is normalized to DPBS at a value of 1. (C) Live-cell confocal microscopy images showing average intensities from six consecutive 1 μm slices of HeLa cells treated with the KLA peptide or polymer (m ∼ 10). Scale bars are 50 μm. (D) Viability of cells treated with KLA polymers (m ∼ 5), the KLAfragment polymer (m ∼ 10), GSGSGRR polymer (m ∼ 60), GSGSGKK polymer (m ∼ 60) and the KLA peptide. LD50 values for the KLA polymers, obtained by fitting data to the Hill equation, are 12.5, 25, and 30 μM for the m ∼ 5, 10 and 15 polymers, respectively. Note that the dose–response curves for the m ∼ 10 and 15 KLA polymers are provided in Fig. S18. (E) Mitochondrial membrane potential disruption assays. The percentages given describe the percent of signal resulting from each material in the disrupted mitochondria region. (F) Annexin V cell staining assay to identify apoptotic cells. A rightward population shift is indicative of an increase in apoptotic cells. Staurosporine (Staur.) is a known positive control for apoptosis and behaves identically to the KLA polymer in this assay (∼5-fold increase). (G) Propidium iodide cell staining assay for the identification of necrotic cells. DMSO-treated cells show a ∼40-fold increase in necrotic cells, as indicated by an increase in fluorescence of a cell population, whereas KLA polymer and staurosporine-treated cells show no shift.
Fig. 4
Fig. 4. Mechanistic studies and resistance to proteases. (A) Flow cytometry data describing pharmacological inhibition of dynamin-mediated endocytosis by dynasore, membrane fluidity by methyl-β-cyclodextrin (M-βCD) or membrane trafficking by a reduction in incubation temperature. Data is normalized to DPBS at a value of 1. (B) Proteolytic susceptibility was determined by comparing RP-HPLC chromatograms of the material before and after treatment with trypsin or the protease cocktail pronase. Standard curves and individual chromatograms are provided in Fig. S22–S25.

References

    1. Craik D. J., Fairlie D. P., Liras S., Price D. Chem. Biol. Drug Des. 2013;81:136–147. - PubMed
    1. Kaspar A. A., Reichert J. M. Drug Discovery Today. 2013;18:807–817. - PubMed
    1. McGregor D. P. Curr. Opin. Pharmacol. 2008;8:616–619. - PubMed
    1. Vlieghe P., Lisowski V., Martinez J., Khrestchatisky M. Drug Discovery Today. 2010;15:40–56. - PubMed
    1. Pazos E., Vazquez O., Mascarenas J. L., Vazquez M. E. Chem. Soc. Rev. 2009;38:3348–3359. - PubMed